
Size of this preview:
800 × 555 pixels. Other resolutions:
320 × 222 pixels |
640 × 444 pixels |
1,024 × 710 pixels |
1,280 × 888 pixels |
1,550 × 1,075 pixels.
Original file (1,550 × 1,075 pixels, file size: 197 KB, MIME type: image/png)
| This is a file from the
Wikimedia Commons. Information from its
description page there is shown below. Commons is a freely licensed media file repository. You can help. |
Summary
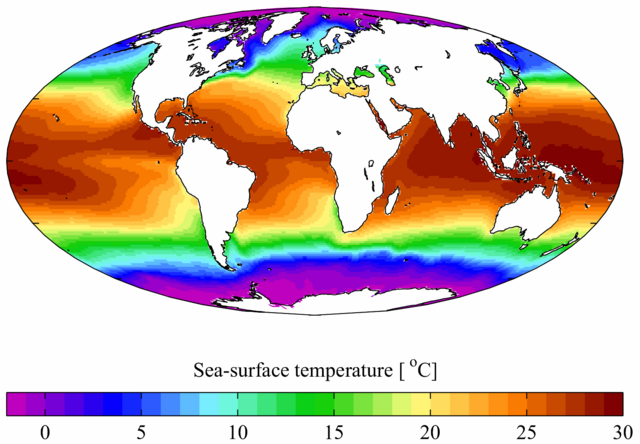
| Description | Annual mean sea surface temperature from the World Ocean Atlas 2001. Temperature here is in degrees Celsius. It is plotted here using a Mollweide projection (using MATLAB and the M_Map package). |
| Source | Own work by the original uploader |
| Author | Plumbago ( talk · contribs) |
Licensing
Plumbago at the
English-language Wikipedia, the copyright holder of this work, hereby publishes it under the following license:
| This file is licensed under the Creative Commons Attribution-Share Alike 3.0 Unported license. Subject to disclaimers. | ||
| Attribution: Plumbago at the English-language Wikipedia | ||
| ||
| This licensing tag was added to this file as part of the GFDL licensing update. |

|
Permission is granted to copy, distribute and/or modify this document under the terms of the GNU Free Documentation License, Version 1.2 or any later version published by the Free Software Foundation; with no Invariant Sections, no Front-Cover Texts, and no Back-Cover Texts. A copy of the license is included in the section entitled GNU Free Documentation License. Subject to disclaimers. |
File history
Click on a date/time to view the file as it appeared at that time.
| Date/Time | Thumbnail | Dimensions | User | Comment | |
|---|---|---|---|---|---|
| current | 01:25, 5 June 2022 |
| 1,550 × 1,075 (197 KB) | Hike395 | improve compression |
| 21:58, 4 August 2006 |
 | 1,550 × 1,075 (265 KB) | ...---...SOS | == Summary == Annual mean sea surface temperature from the [http://www.nodc.noaa.gov/OC5/WOA01/ World Ocean Atlas 2001]. Temperature here is in degrees Celsius. It is plotted here using a Mollweide projection (using MATLAB and the [h |
File usage
The following pages on the English Wikipedia use this file (pages on other projects are not listed):
Global file usage
The following other wikis use this file:
- Usage on ar.wikipedia.org
- عاصفة
- عاصفة ثلجية
- ويكيبيديا:قوالب/بذور
- ويكيبيديا:قوالب/بذور/جدول بذرة 1
- قالب:بذرة أرصاد جوية
- ثائب
- سديم (ضباب)
- سحاب ممزق
- طقس
- حالة البحر
- نيزك جليدي ضخم
- سد جليدي
- سمحاق طبقي
- جبهة قطبية
- مرتفع جوي
- جيب هواء
- قرينة الرطوبة
- سحاب قوسي
- رياح غربية
- أمواج روسبي
- قائمة أنواع السحب
- هرمتان (رياح)
- مسجل ارتفاع السحاب
- برج حار
- مسجل الرطوبة والحرارة
- اللباش (رياح)
- ميسترال (رياح)
- تغيم
- خريطة الطقس
- درجات حرارة جوية
- تأرجح قطبي
- ميترك
- العروض الوسطى
- ميتيوجرام
- درجة حرارة جزيئية
- عرض بيانات المحيط
- علم الطقس العدلي
- مشروع إعادة التحليل الخاص بالمركز الأوروبي للتنبؤات الجوية المتوسطة المدى
- مؤشر هينز
- نموذج هيلد-هو
- أرصاد جوية مائية
- صقيع متجمد
- ضباب إشعاعي
- قارة بحرية
- رياح جنوبية (علم الأرصاد)
- برد دقيق
- مستخدم:Adnanzoom/مساعدات
- مطر متجمد
- جبهة باردة
- جبهة دافئة
View more global usage of this file.
Size of this preview:
800 × 555 pixels. Other resolutions:
320 × 222 pixels |
640 × 444 pixels |
1,024 × 710 pixels |
1,280 × 888 pixels |
1,550 × 1,075 pixels.
Original file (1,550 × 1,075 pixels, file size: 197 KB, MIME type: image/png)
| This is a file from the
Wikimedia Commons. Information from its
description page there is shown below. Commons is a freely licensed media file repository. You can help. |
Summary
| Description | Annual mean sea surface temperature from the World Ocean Atlas 2001. Temperature here is in degrees Celsius. It is plotted here using a Mollweide projection (using MATLAB and the M_Map package). |
| Source | Own work by the original uploader |
| Author | Plumbago ( talk · contribs) |
Licensing
Plumbago at the
English-language Wikipedia, the copyright holder of this work, hereby publishes it under the following license:
| This file is licensed under the Creative Commons Attribution-Share Alike 3.0 Unported license. Subject to disclaimers. | ||
| Attribution: Plumbago at the English-language Wikipedia | ||
| ||
| This licensing tag was added to this file as part of the GFDL licensing update. |
|
|
Permission is granted to copy, distribute and/or modify this document under the terms of the GNU Free Documentation License, Version 1.2 or any later version published by the Free Software Foundation; with no Invariant Sections, no Front-Cover Texts, and no Back-Cover Texts. A copy of the license is included in the section entitled GNU Free Documentation License. Subject to disclaimers. |
File history
Click on a date/time to view the file as it appeared at that time.
| Date/Time | Thumbnail | Dimensions | User | Comment | |
|---|---|---|---|---|---|
| current | 01:25, 5 June 2022 |
| 1,550 × 1,075 (197 KB) | Hike395 | improve compression |
| 21:58, 4 August 2006 |
| 1,550 × 1,075 (265 KB) | ...---...SOS | == Summary == Annual mean sea surface temperature from the [http://www.nodc.noaa.gov/OC5/WOA01/ World Ocean Atlas 2001]. Temperature here is in degrees Celsius. It is plotted here using a Mollweide projection (using MATLAB and the [h |
File usage
The following pages on the English Wikipedia use this file (pages on other projects are not listed):
Global file usage
The following other wikis use this file:
- Usage on ar.wikipedia.org
- عاصفة
- عاصفة ثلجية
- ويكيبيديا:قوالب/بذور
- ويكيبيديا:قوالب/بذور/جدول بذرة 1
- قالب:بذرة أرصاد جوية
- ثائب
- سديم (ضباب)
- سحاب ممزق
- طقس
- حالة البحر
- نيزك جليدي ضخم
- سد جليدي
- سمحاق طبقي
- جبهة قطبية
- مرتفع جوي
- جيب هواء
- قرينة الرطوبة
- سحاب قوسي
- رياح غربية
- أمواج روسبي
- قائمة أنواع السحب
- هرمتان (رياح)
- مسجل ارتفاع السحاب
- برج حار
- مسجل الرطوبة والحرارة
- اللباش (رياح)
- ميسترال (رياح)
- تغيم
- خريطة الطقس
- درجات حرارة جوية
- تأرجح قطبي
- ميترك
- العروض الوسطى
- ميتيوجرام
- درجة حرارة جزيئية
- عرض بيانات المحيط
- علم الطقس العدلي
- مشروع إعادة التحليل الخاص بالمركز الأوروبي للتنبؤات الجوية المتوسطة المدى
- مؤشر هينز
- نموذج هيلد-هو
- أرصاد جوية مائية
- صقيع متجمد
- ضباب إشعاعي
- قارة بحرية
- رياح جنوبية (علم الأرصاد)
- برد دقيق
- مستخدم:Adnanzoom/مساعدات
- مطر متجمد
- جبهة باردة
- جبهة دافئة
View more global usage of this file.