
Size of this PNG preview of this SVG file:
800 × 475 pixels. Other resolutions:
320 × 190 pixels |
640 × 380 pixels |
1,024 × 608 pixels |
1,280 × 760 pixels |
2,560 × 1,519 pixels |
1,363 × 809 pixels.
Original file (SVG file, nominally 1,363 × 809 pixels, file size: 13 KB)
| This is a file from the
Wikimedia Commons. Information from its
description page there is shown below. Commons is a freely licensed media file repository. You can help. |
Summary
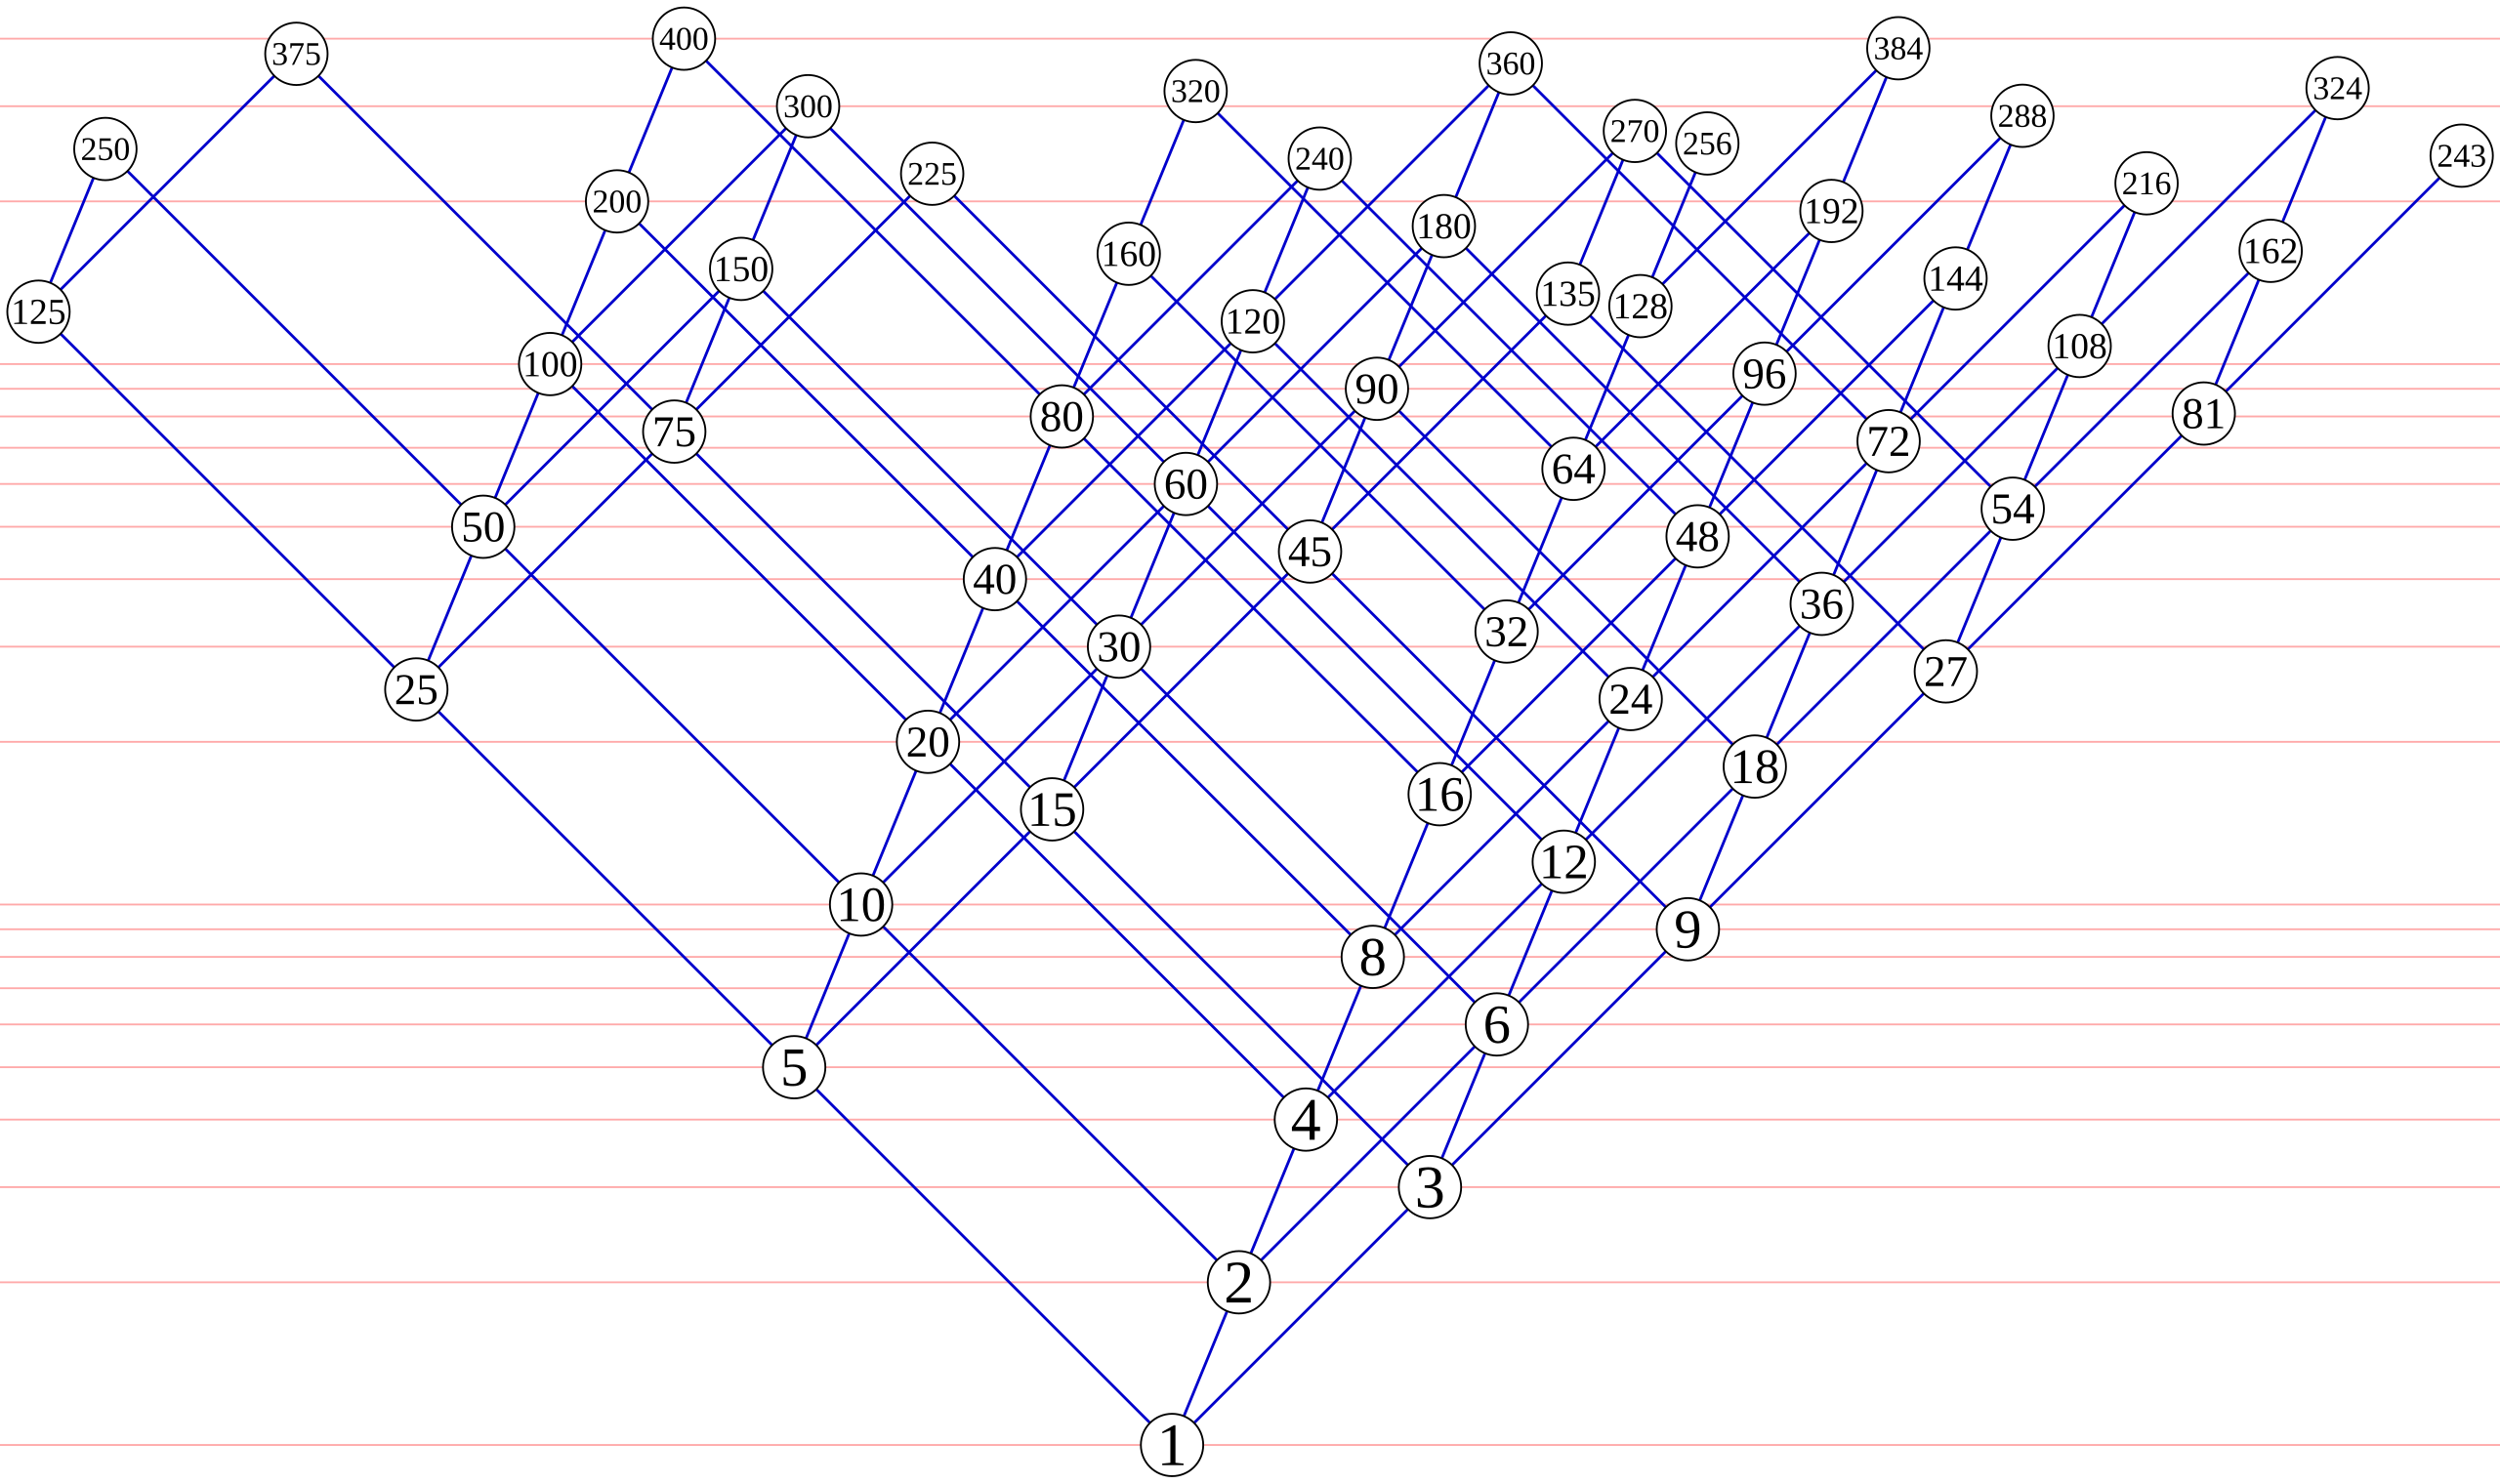
| Description | A Hasse diagram of divisibility relationships among regular numbers up to 400. As shown by the horizontal light red lines, the vertical position of each number is proportional to its logarithm. Inspired by similar diagrams in a paper by Kurenniemi [1]. |
| Date | 14 March 2007 (original upload date) |
| Source | Transferred from en.wikipedia to Commons. |
| Author | David Eppstein at English Wikipedia |
Licensing
| This work has been released into the
public domain by its author,
David Eppstein at
English Wikipedia. This applies worldwide. In some countries this may not be legally possible; if so: David Eppstein grants anyone the right to use this work for any purpose, without any conditions, unless such conditions are required by law. |
Source code
The Python source code for generating this image:
from math import log

limit = 400
radius = 17
margin = 4
xscale = yscale = 128
skew = 0.285

def A051037():
    yield 1
    seq = [1]
    spiders = [(2,2,0,0),(3,3,0,1),(5,5,0,2)]
    while True:
        x,p,i,j = min(spiders)
        if x != seq[-1]:
            yield x
            seq.append(x)
        spiders[j] = (p*seq[i+1],p,i+1,j)

def nfactors(h,p):
    nf = 0
    while h % p == 0:
        nf += 1
        h //= p
    return nf

seq = []
for h in A051037():
    if h > limit:
        break
    seq.append((h,nfactors(h,2),nfactors(h,3),nfactors(h,5)))

leftmost = max([k for h,i,j,k in seq])
rightmost = max([j for h,i,j,k in seq])
leftwidth = int(0.5 + log(5) * leftmost * xscale + radius + margin)
rightwidth = int(0.5 + log(3) * rightmost * xscale + radius + margin)
width = leftwidth + rightwidth
height = int(0.5 + log(limit) * yscale + 2*(radius + margin))

def place(h,i,j,k):
    # logical coordinates
    x = j * log(3) - k * log(5) + i * skew
    y = log(h)

    # physical coordinates
    x = (x*xscale) + leftwidth
    y = (-y*yscale) + height - radius - margin

    return (x,y)

print '''<?xml version="1.0" encoding="utf-8"?>
<!DOCTYPE svg PUBLIC "-//W3C//DTD SVG 1.1//EN" "http://www.w3.org/Graphics/SVG/1.1/DTD/svg11.dtd">
<svg xmlns="http://www.w3.org/2000/svg" version="1.1" width="%d" height="%d">''' % (width,height)

print '    <g style="fill:none;stroke:#ffaaaa;">'

l = 1
base = 1
while l <= limit:
    y = -yscale*log(l) + height - radius - margin
    print '        <path d="M0,%0.2fL%d,%0.2f"/>' % (y,width,y)
    l += base
    if l == 10*base:
        base = l

print "    </g>"
print '    <g style="fill:none;stroke-width:1.5;stroke:#0000cc;">'

def drawSegment(p,q):
    x1,y1=p
    x2,y2=q
    print '        <path d="M%0.2f,%0.2fL%0.2f,%0.2f"/>' % (x1,y1,x2,y2)

for h,i,j,k in seq:
    x,y = place(h,i,j,k)
    if i > 0:
        drawSegment(place(h//2,i-1,j,k),(x,y))
    if j > 0:
        drawSegment(place(h//3,i,j-1,k),(x,y))
    if k > 0:
        drawSegment(place(h//5,i,j,k-1),(x,y))

print "    </g>"
print '    <g style="fill:#ffffff;stroke:#000000;">'

for h,i,j,k in seq:
    x,y = place(h,i,j,k)
    print '        <circle cx="%0.2f" cy="%0.2f" r="%d"/>' % (x,y,radius)

# pairs of first value with size: size of that value
fontsizes = {1:33, 5:30, 10:27, 20:24, 100:20, 200:18}

for h,i,j,k in seq:
    x,y = place(h,i,j,k)
    if h in fontsizes:
        print "    </g>"
        print '    <g style="font-family:Times;font-size:%d;text-anchor:middle;">' % fontsizes[h]
        lower = fontsizes[h] / 3.
    print '        <text x="%0.2f" y="%0.2f">%d</text>' %(x,y+lower,h)
print "    </g>"
print "</svg>"
Original upload log
The original description page was
here. All following user names refer to en.wikipedia.
- 2007-03-14 05:08 David Eppstein 1363×809×0 (13167 bytes) A [[Hasse diagram]] of [[divisibility]] relationships among [[regular number]]s up to 400. Inspired by similar diagrams in a paper by Kurenniemi [http://www.beige.org/projects/dimi/CSDL2.pdf].
File history
Click on a date/time to view the file as it appeared at that time.
| Date/Time | Thumbnail | Dimensions | User | Comment | |
|---|---|---|---|---|---|
| current | 02:57, 13 March 2010 |
| 1,363 × 809 (13 KB) | David Eppstein | Fix fonts |
| 22:10, 24 July 2007 |
 | 1,363 × 809 (13 KB) | David Eppstein | {{Information |Description=A en:Hasse diagram of en:divisibility relationships among en:regular numbers up to 400. As shown by the horizontal light red lines, the vertical position of each number is proportional to its en:logarithm. In |
File usage
The following pages on the English Wikipedia use this file (pages on other projects are not listed):
Global file usage
The following other wikis use this file:
- Usage on hu.wikipedia.org
- Usage on kk.wikipedia.org
- Usage on ru.wikipedia.org
- Usage on sv.wikipedia.org
- Usage on zh.wikipedia.org
Size of this PNG preview of this SVG file:
800 × 475 pixels. Other resolutions:
320 × 190 pixels |
640 × 380 pixels |
1,024 × 608 pixels |
1,280 × 760 pixels |
2,560 × 1,519 pixels |
1,363 × 809 pixels.
Original file (SVG file, nominally 1,363 × 809 pixels, file size: 13 KB)
| This is a file from the
Wikimedia Commons. Information from its
description page there is shown below. Commons is a freely licensed media file repository. You can help. |
Summary
| Description | A Hasse diagram of divisibility relationships among regular numbers up to 400. As shown by the horizontal light red lines, the vertical position of each number is proportional to its logarithm. Inspired by similar diagrams in a paper by Kurenniemi [1]. |
| Date | 14 March 2007 (original upload date) |
| Source | Transferred from en.wikipedia to Commons. |
| Author | David Eppstein at English Wikipedia |
Licensing
| This work has been released into the
public domain by its author,
David Eppstein at
English Wikipedia. This applies worldwide. In some countries this may not be legally possible; if so: David Eppstein grants anyone the right to use this work for any purpose, without any conditions, unless such conditions are required by law. |
Source code
The Python source code for generating this image:
from math import log

limit = 400
radius = 17
margin = 4
xscale = yscale = 128
skew = 0.285

def A051037():
    yield 1
    seq = [1]
    spiders = [(2,2,0,0),(3,3,0,1),(5,5,0,2)]
    while True:
        x,p,i,j = min(spiders)
        if x != seq[-1]:
            yield x
            seq.append(x)
        spiders[j] = (p*seq[i+1],p,i+1,j)

def nfactors(h,p):
    nf = 0
    while h % p == 0:
        nf += 1
        h //= p
    return nf

seq = []
for h in A051037():
    if h > limit:
        break
    seq.append((h,nfactors(h,2),nfactors(h,3),nfactors(h,5)))

leftmost = max([k for h,i,j,k in seq])
rightmost = max([j for h,i,j,k in seq])
leftwidth = int(0.5 + log(5) * leftmost * xscale + radius + margin)
rightwidth = int(0.5 + log(3) * rightmost * xscale + radius + margin)
width = leftwidth + rightwidth
height = int(0.5 + log(limit) * yscale + 2*(radius + margin))

def place(h,i,j,k):
    # logical coordinates
    x = j * log(3) - k * log(5) + i * skew
    y = log(h)

    # physical coordinates
    x = (x*xscale) + leftwidth
    y = (-y*yscale) + height - radius - margin

    return (x,y)

print '''<?xml version="1.0" encoding="utf-8"?>
<!DOCTYPE svg PUBLIC "-//W3C//DTD SVG 1.1//EN" "http://www.w3.org/Graphics/SVG/1.1/DTD/svg11.dtd">
<svg xmlns="http://www.w3.org/2000/svg" version="1.1" width="%d" height="%d">''' % (width,height)

print '    <g style="fill:none;stroke:#ffaaaa;">'

l = 1
base = 1
while l <= limit:
    y = -yscale*log(l) + height - radius - margin
    print '        <path d="M0,%0.2fL%d,%0.2f"/>' % (y,width,y)
    l += base
    if l == 10*base:
        base = l

print "    </g>"
print '    <g style="fill:none;stroke-width:1.5;stroke:#0000cc;">'

def drawSegment(p,q):
    x1,y1=p
    x2,y2=q
    print '        <path d="M%0.2f,%0.2fL%0.2f,%0.2f"/>' % (x1,y1,x2,y2)

for h,i,j,k in seq:
    x,y = place(h,i,j,k)
    if i > 0:
        drawSegment(place(h//2,i-1,j,k),(x,y))
    if j > 0:
        drawSegment(place(h//3,i,j-1,k),(x,y))
    if k > 0:
        drawSegment(place(h//5,i,j,k-1),(x,y))

print "    </g>"
print '    <g style="fill:#ffffff;stroke:#000000;">'

for h,i,j,k in seq:
    x,y = place(h,i,j,k)
    print '        <circle cx="%0.2f" cy="%0.2f" r="%d"/>' % (x,y,radius)

# pairs of first value with size: size of that value
fontsizes = {1:33, 5:30, 10:27, 20:24, 100:20, 200:18}

for h,i,j,k in seq:
    x,y = place(h,i,j,k)
    if h in fontsizes:
        print "    </g>"
        print '    <g style="font-family:Times;font-size:%d;text-anchor:middle;">' % fontsizes[h]
        lower = fontsizes[h] / 3.
    print '        <text x="%0.2f" y="%0.2f">%d</text>' %(x,y+lower,h)
print "    </g>"
print "</svg>"
Original upload log
The original description page was
here. All following user names refer to en.wikipedia.
- 2007-03-14 05:08 David Eppstein 1363×809×0 (13167 bytes) A [[Hasse diagram]] of [[divisibility]] relationships among [[regular number]]s up to 400. Inspired by similar diagrams in a paper by Kurenniemi [http://www.beige.org/projects/dimi/CSDL2.pdf].
File history
Click on a date/time to view the file as it appeared at that time.
| Date/Time | Thumbnail | Dimensions | User | Comment | |
|---|---|---|---|---|---|
| current | 02:57, 13 March 2010 |
| 1,363 × 809 (13 KB) | David Eppstein | Fix fonts |
| 22:10, 24 July 2007 |
| 1,363 × 809 (13 KB) | David Eppstein | {{Information |Description=A en:Hasse diagram of en:divisibility relationships among en:regular numbers up to 400. As shown by the horizontal light red lines, the vertical position of each number is proportional to its en:logarithm. In |
File usage
The following pages on the English Wikipedia use this file (pages on other projects are not listed):
Global file usage
The following other wikis use this file:
- Usage on hu.wikipedia.org
- Usage on kk.wikipedia.org
- Usage on ru.wikipedia.org
- Usage on sv.wikipedia.org
- Usage on zh.wikipedia.org