
Original file (SVG file, nominally 1,000 × 700 pixels, file size: 461 KB)
| This is a file from the
Wikimedia Commons. Information from its
description page there is shown below. Commons is a freely licensed media file repository. You can help. |

|
This SVG file contains embedded text that can be translated into your language, using any capable SVG editor, text editor or the SVG Translate tool. For more information see: About translating SVG files. |
Summary
| Description |
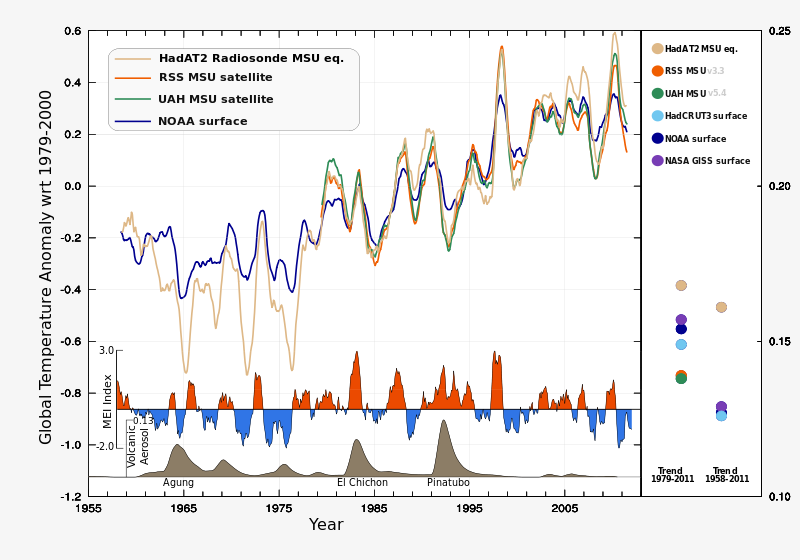
English: Lower troposphere satellite/radiosonde and surface 12 month running mean global temperature anomaly with respect to 1979-2000.
Surface temperature: NOAA/NCDC - http://www.ncdc.noaa.gov/cmb-faq/anomalies.html Satellite lower troposphere temperature: RSS MSU- http://www.remss.com/data/msu/ UAH MSU- http://vortex.nsstc.uah.edu/public/msu/t2lt/ Radiosonde lower troposphere MSU weighted: HadAT2- http://hadobs.metoffice.com/hadat/msu_equivalents.html mei index: http://www.esrl.noaa.gov/psd/enso/mei/ stratospheric aerosol optical thickness(12-month running mean): http://data.giss.nasa.gov/modelforce/strataer/ Global temperature is subject to short-term fluctuations, mainly due to enso and explosive volcanic eruption, that are larger in the troposphere because the tropical troposphere follow a moist adiabatic lapse rate. http://en.wikipedia.org/wiki/Lapse_rate#Saturated_adiabatic_lapse_rate |
| Source | Own work |
| Author | Giorgiogp2 |
Licensing
- You are free:
- to share – to copy, distribute and transmit the work
- to remix – to adapt the work
- Under the following conditions:
- attribution – You must give appropriate credit, provide a link to the license, and indicate if changes were made. You may do so in any reasonable manner, but not in any way that suggests the licensor endorses you or your use.
- share alike – If you remix, transform, or build upon the material, you must distribute your contributions under the same or compatible license as the original.

|
Permission is granted to copy, distribute and/or modify this document under the terms of the GNU Free Documentation License, Version 1.2 or any later version published by the Free Software Foundation; with no Invariant Sections, no Front-Cover Texts, and no Back-Cover Texts. A copy of the license is included in the section entitled GNU Free Documentation License. |
File history
Click on a date/time to view the file as it appeared at that time.
| Date/Time | Thumbnail | Dimensions | User | Comment | |
|---|---|---|---|---|---|
| current | 21:28, 18 February 2012 |
| 1,000 × 700 (461 KB) | Giorgiogp2 | update data, add mei index and volcanic aerosol |
| 18:31, 13 February 2011 |
 | 900 × 640 (579 KB) | Giorgiogp2 | trend | |
| 17:46, 13 February 2011 |
 | 900 × 640 (552 KB) | Giorgiogp2 | {{Information |Description ={{en|1=Lower troposphere satellite/radiosonde and surface 12 month running mean global temperature anomaly with respect to 1979-2000. Surface temperature: NOAA/NCDC - http://www.ncdc.noaa.gov/cmb-faq/anomalies.html Satell |
File usage
Global file usage
The following other wikis use this file:
- Usage on cs.wikipedia.org
- Usage on de.wikipedia.org
Original file (SVG file, nominally 1,000 × 700 pixels, file size: 461 KB)
| This is a file from the
Wikimedia Commons. Information from its
description page there is shown below. Commons is a freely licensed media file repository. You can help. |
|
|
This SVG file contains embedded text that can be translated into your language, using any capable SVG editor, text editor or the SVG Translate tool. For more information see: About translating SVG files. |
Summary
| Description |
English: Lower troposphere satellite/radiosonde and surface 12 month running mean global temperature anomaly with respect to 1979-2000.
Surface temperature: NOAA/NCDC - http://www.ncdc.noaa.gov/cmb-faq/anomalies.html Satellite lower troposphere temperature: RSS MSU- http://www.remss.com/data/msu/ UAH MSU- http://vortex.nsstc.uah.edu/public/msu/t2lt/ Radiosonde lower troposphere MSU weighted: HadAT2- http://hadobs.metoffice.com/hadat/msu_equivalents.html mei index: http://www.esrl.noaa.gov/psd/enso/mei/ stratospheric aerosol optical thickness(12-month running mean): http://data.giss.nasa.gov/modelforce/strataer/ Global temperature is subject to short-term fluctuations, mainly due to enso and explosive volcanic eruption, that are larger in the troposphere because the tropical troposphere follow a moist adiabatic lapse rate. http://en.wikipedia.org/wiki/Lapse_rate#Saturated_adiabatic_lapse_rate |
| Source | Own work |
| Author | Giorgiogp2 |
Licensing
- You are free:
- to share – to copy, distribute and transmit the work
- to remix – to adapt the work
- Under the following conditions:
- attribution – You must give appropriate credit, provide a link to the license, and indicate if changes were made. You may do so in any reasonable manner, but not in any way that suggests the licensor endorses you or your use.
- share alike – If you remix, transform, or build upon the material, you must distribute your contributions under the same or compatible license as the original.
|
|
Permission is granted to copy, distribute and/or modify this document under the terms of the GNU Free Documentation License, Version 1.2 or any later version published by the Free Software Foundation; with no Invariant Sections, no Front-Cover Texts, and no Back-Cover Texts. A copy of the license is included in the section entitled GNU Free Documentation License. |
File history
Click on a date/time to view the file as it appeared at that time.
| Date/Time | Thumbnail | Dimensions | User | Comment | |
|---|---|---|---|---|---|
| current | 21:28, 18 February 2012 |
| 1,000 × 700 (461 KB) | Giorgiogp2 | update data, add mei index and volcanic aerosol |
| 18:31, 13 February 2011 |
| 900 × 640 (579 KB) | Giorgiogp2 | trend | |
| 17:46, 13 February 2011 |
| 900 × 640 (552 KB) | Giorgiogp2 | {{Information |Description ={{en|1=Lower troposphere satellite/radiosonde and surface 12 month running mean global temperature anomaly with respect to 1979-2000. Surface temperature: NOAA/NCDC - http://www.ncdc.noaa.gov/cmb-faq/anomalies.html Satell |
File usage
Global file usage
The following other wikis use this file:
- Usage on cs.wikipedia.org
- Usage on de.wikipedia.org