
Size of this PNG preview of this SVG file:
482 × 368 pixels. Other resolutions:
315 × 240 pixels |
629 × 480 pixels |
1,006 × 768 pixels |
1,280 × 977 pixels |
2,560 × 1,955 pixels.
Original file (SVG file, nominally 482 × 368 pixels, file size: 18 KB)
| This is a file from the
Wikimedia Commons. Information from its
description page there is shown below. Commons is a freely licensed media file repository. You can help. |
Summary
| Description |
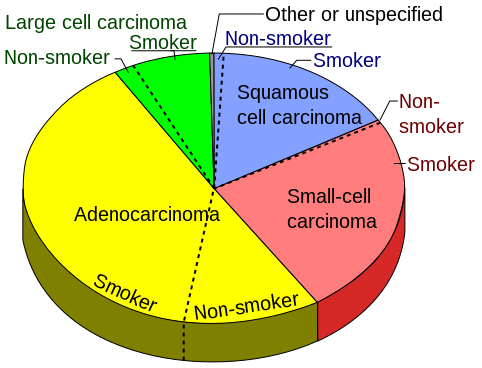
English: Pie chart of the incidence of
lung cancer types, sorted by histological subtypes, in turn sorted into how many are non-smokers versus smokers - defined as current or former smoker of more than 1 year of duration according to:
Raw data: Squamous Cell Carcinoma - non-smoker: 1,0% Squamous Cell Carcinoma - smoker: 15,7% Small Cell Carcinoma - non-smoker: 0,3% Small Cell Carcinoma - smoker: 24,0% Adenocarcinoma - non-smoker: 11,6% Adenocarcinoma - smoker: 38,9% Large Cell Carcinoma - non-smoker: 1,5% Large Cell Carcinoma - smoker: 6,7% Other or unspecified: 0,4%. |
| Date | |
| Source | Own work |
| Author |
When using this image in external works, it may be cited as:
or
|
Licensing
I, the copyright holder of this work, hereby publish it under the following license:
| This file is made available under the Creative Commons CC0 1.0 Universal Public Domain Dedication. | |
| The person who associated a work with this deed has dedicated the work to the
public domain by waiving all of their rights to the work worldwide under copyright law, including all related and neighboring rights, to the extent allowed by law. You can copy, modify, distribute and perform the work, even for commercial purposes, all without asking permission.
|
File history
Click on a date/time to view the file as it appeared at that time.
| Date/Time | Thumbnail | Dimensions | User | Comment | |
|---|---|---|---|---|---|
| current | 16:05, 6 March 2019 |
| 482 × 368 (18 KB) | David.haberthuer | Reverted to version as of 16:35, 10 June 2011 (UTC) |
| 15:56, 6 March 2019 |
 | 1,143 × 644 (27 KB) | David.haberthuer | Redrawn with matplotlib in Python. The full drawing is done in this Jupyter notebook: https://github.com/habi/wikipedia-plots/blob/master/Cancer%20pie%20chart.ipynb | |
| 16:35, 10 June 2011 |
 | 482 × 368 (18 KB) | Mikael Häggström | {{Information |Description ={{en|1=Pie chart of the incidence of lung cancer types, sorted by histological subtypes, in turn sorted into how many are non-smokers versus smokers - defined as current or former smoker of more than 1 ye |
File usage
The following pages on the English Wikipedia use this file (pages on other projects are not listed):
Global file usage
The following other wikis use this file:
- Usage on ar.wikipedia.org
- Usage on bs.wikipedia.org
- Usage on el.wikipedia.org
- Usage on en.wikiversity.org
- Usage on ha.wikipedia.org
- Usage on he.wikipedia.org
- Usage on hy.wikipedia.org
- Usage on ko.wikipedia.org
- Usage on pl.wikipedia.org
- Usage on pt.wikipedia.org
- Usage on ru.wikipedia.org
- Usage on sh.wikipedia.org
- Usage on sv.wikipedia.org
Metadata
Size of this PNG preview of this SVG file:
482 × 368 pixels. Other resolutions:
315 × 240 pixels |
629 × 480 pixels |
1,006 × 768 pixels |
1,280 × 977 pixels |
2,560 × 1,955 pixels.
Original file (SVG file, nominally 482 × 368 pixels, file size: 18 KB)
| This is a file from the
Wikimedia Commons. Information from its
description page there is shown below. Commons is a freely licensed media file repository. You can help. |
Summary
| Description |
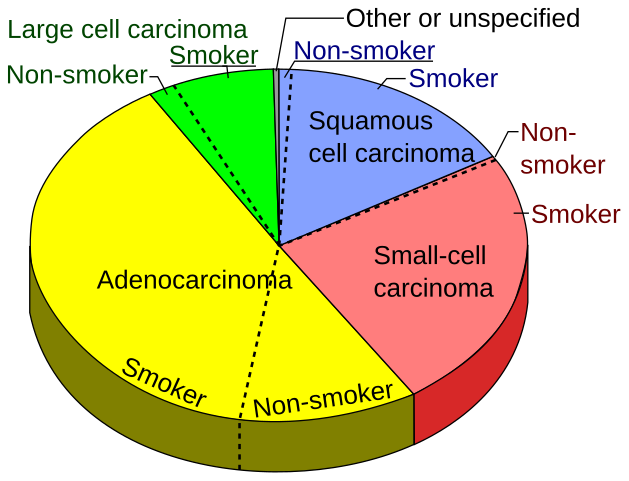
English: Pie chart of the incidence of
lung cancer types, sorted by histological subtypes, in turn sorted into how many are non-smokers versus smokers - defined as current or former smoker of more than 1 year of duration according to:
Raw data: Squamous Cell Carcinoma - non-smoker: 1,0% Squamous Cell Carcinoma - smoker: 15,7% Small Cell Carcinoma - non-smoker: 0,3% Small Cell Carcinoma - smoker: 24,0% Adenocarcinoma - non-smoker: 11,6% Adenocarcinoma - smoker: 38,9% Large Cell Carcinoma - non-smoker: 1,5% Large Cell Carcinoma - smoker: 6,7% Other or unspecified: 0,4%. |
| Date | |
| Source | Own work |
| Author |
When using this image in external works, it may be cited as:
or
|
Licensing
I, the copyright holder of this work, hereby publish it under the following license:
| This file is made available under the Creative Commons CC0 1.0 Universal Public Domain Dedication. | |
| The person who associated a work with this deed has dedicated the work to the
public domain by waiving all of their rights to the work worldwide under copyright law, including all related and neighboring rights, to the extent allowed by law. You can copy, modify, distribute and perform the work, even for commercial purposes, all without asking permission.
|
File history
Click on a date/time to view the file as it appeared at that time.
| Date/Time | Thumbnail | Dimensions | User | Comment | |
|---|---|---|---|---|---|
| current | 16:05, 6 March 2019 |
| 482 × 368 (18 KB) | David.haberthuer | Reverted to version as of 16:35, 10 June 2011 (UTC) |
| 15:56, 6 March 2019 |
| 1,143 × 644 (27 KB) | David.haberthuer | Redrawn with matplotlib in Python. The full drawing is done in this Jupyter notebook: https://github.com/habi/wikipedia-plots/blob/master/Cancer%20pie%20chart.ipynb | |
| 16:35, 10 June 2011 |
| 482 × 368 (18 KB) | Mikael Häggström | {{Information |Description ={{en|1=Pie chart of the incidence of lung cancer types, sorted by histological subtypes, in turn sorted into how many are non-smokers versus smokers - defined as current or former smoker of more than 1 ye |
File usage
The following pages on the English Wikipedia use this file (pages on other projects are not listed):
Global file usage
The following other wikis use this file:
- Usage on ar.wikipedia.org
- Usage on bs.wikipedia.org
- Usage on el.wikipedia.org
- Usage on en.wikiversity.org
- Usage on ha.wikipedia.org
- Usage on he.wikipedia.org
- Usage on hy.wikipedia.org
- Usage on ko.wikipedia.org
- Usage on pl.wikipedia.org
- Usage on pt.wikipedia.org
- Usage on ru.wikipedia.org
- Usage on sh.wikipedia.org
- Usage on sv.wikipedia.org