
Size of this preview:
776 × 600 pixels. Other resolutions:
311 × 240 pixels |
621 × 480 pixels |
994 × 768 pixels |
1,280 × 989 pixels |
1,584 × 1,224 pixels.
Original file (1,584 × 1,224 pixels, file size: 227 KB, MIME type: image/png)
| This is a file from the
Wikimedia Commons. Information from its
description page there is shown below. Commons is a freely licensed media file repository. You can help. |
Summary
| Description |
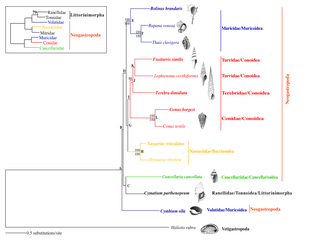
English: Phylogenetic relationships within Gastropoda. Maximum likelihood phylogram based on the nucleotide sequences of the rRNA, tRNA and protein-coding genes of all available complete mt genomes of neogastropods, and one Vetigastropoda (Haliotis rubra), chosen as outgroup (allnuc data set). Species whose complete mt genome was sequenced in this study are presented in bold. Numbers in the nodes correspond to Maximum likelihood bootstrap proportions (above branches) and Bayesian inference posterior probabilities (below branches). Only values above 70% are depicted. The inset shows a Maximum likelihood topology based on fragments of mitochondrial and nuclear data (adapted from Fig. 2 of
Colgan et al., 2007). Letters A-K label nodes used in the analysis of phylogenetic performance. |
| Date | |
| Source | Cunha R. L., Grande C. & Zardoya R. (2009). "Neogastropod phylogenetic relationships based on entire mitochondrial genomes". BMC Evolutionary Biology 9:210. doi:10.1186/1471-2148-9-210. |
| Author | Cunha R. L., Grande C. & Zardoya R. (2009). |
Licensing
This file is licensed under the
Creative Commons
Attribution 2.0 Generic license.
- You are free:
- to share – to copy, distribute and transmit the work
- to remix – to adapt the work
- Under the following conditions:
- attribution – You must give appropriate credit, provide a link to the license, and indicate if changes were made. You may do so in any reasonable manner, but not in any way that suggests the licensor endorses you or your use.
File history
Click on a date/time to view the file as it appeared at that time.
| Date/Time | Thumbnail | Dimensions | User | Comment | |
|---|---|---|---|---|---|
| current | 14:54, 24 July 2012 |
| 1,584 × 1,224 (227 KB) | Daniel Mietchen |
File usage
The following pages on the English Wikipedia use this file (pages on other projects are not listed):
- User:Daniel Mietchen/Talks/CoSci12/Reuse scenarios
- User:Daniel Mietchen/Talks/Zoologisches Kolloquium Jena/Wikimedia and Open Access/Reuse of Open Access materials on Wikimedia platforms
- Wikipedia:WikiProject Open/Open access task force/Wikimedia at OAI8/Reuse of Open Access materials on Wikimedia platforms
Metadata
Size of this preview:
776 × 600 pixels. Other resolutions:
311 × 240 pixels |
621 × 480 pixels |
994 × 768 pixels |
1,280 × 989 pixels |
1,584 × 1,224 pixels.
Original file (1,584 × 1,224 pixels, file size: 227 KB, MIME type: image/png)
| This is a file from the
Wikimedia Commons. Information from its
description page there is shown below. Commons is a freely licensed media file repository. You can help. |
Summary
| Description |
English: Phylogenetic relationships within Gastropoda. Maximum likelihood phylogram based on the nucleotide sequences of the rRNA, tRNA and protein-coding genes of all available complete mt genomes of neogastropods, and one Vetigastropoda (Haliotis rubra), chosen as outgroup (allnuc data set). Species whose complete mt genome was sequenced in this study are presented in bold. Numbers in the nodes correspond to Maximum likelihood bootstrap proportions (above branches) and Bayesian inference posterior probabilities (below branches). Only values above 70% are depicted. The inset shows a Maximum likelihood topology based on fragments of mitochondrial and nuclear data (adapted from Fig. 2 of
Colgan et al., 2007). Letters A-K label nodes used in the analysis of phylogenetic performance. |
| Date | |
| Source | Cunha R. L., Grande C. & Zardoya R. (2009). "Neogastropod phylogenetic relationships based on entire mitochondrial genomes". BMC Evolutionary Biology 9:210. doi:10.1186/1471-2148-9-210. |
| Author | Cunha R. L., Grande C. & Zardoya R. (2009). |
Licensing
This file is licensed under the
Creative Commons
Attribution 2.0 Generic license.
- You are free:
- to share – to copy, distribute and transmit the work
- to remix – to adapt the work
- Under the following conditions:
- attribution – You must give appropriate credit, provide a link to the license, and indicate if changes were made. You may do so in any reasonable manner, but not in any way that suggests the licensor endorses you or your use.
File history
Click on a date/time to view the file as it appeared at that time.
| Date/Time | Thumbnail | Dimensions | User | Comment | |
|---|---|---|---|---|---|
| current | 14:54, 24 July 2012 |
| 1,584 × 1,224 (227 KB) | Daniel Mietchen |
File usage
The following pages on the English Wikipedia use this file (pages on other projects are not listed):
- User:Daniel Mietchen/Talks/CoSci12/Reuse scenarios
- User:Daniel Mietchen/Talks/Zoologisches Kolloquium Jena/Wikimedia and Open Access/Reuse of Open Access materials on Wikimedia platforms
- Wikipedia:WikiProject Open/Open access task force/Wikimedia at OAI8/Reuse of Open Access materials on Wikimedia platforms