
Size of this preview:
800 × 490 pixels. Other resolutions:
320 × 196 pixels |
640 × 392 pixels |
1,024 × 627 pixels |
1,280 × 784 pixels |
2,778 × 1,702 pixels.
Original file (2,778 × 1,702 pixels, file size: 426 KB, MIME type: image/png)
| This is a file from the
Wikimedia Commons. Information from its
description page there is shown below. Commons is a freely licensed media file repository. You can help. |
Summary
| Description |
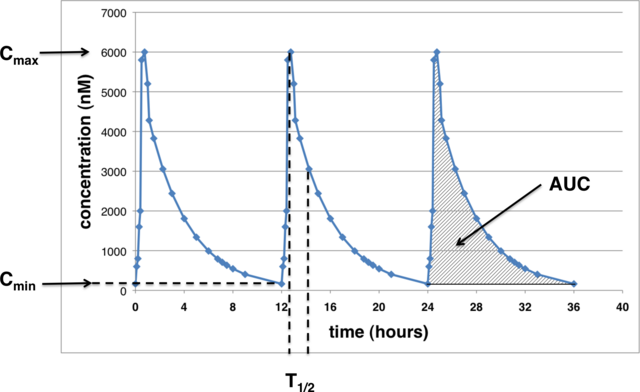
English: Illustrations the time course of plasma drug concentrations over 36 hours, following administrations a drug every 12 hours. |
| Date | |
| Source | Own work |
| Author | Boghog2 |
Licensing
| I, the copyright holder of this work, release this work into the
public domain. This applies worldwide. In some countries this may not be legally possible; if so: I grant anyone the right to use this work for any purpose, without any conditions, unless such conditions are required by law. |
File history
Click on a date/time to view the file as it appeared at that time.
| Date/Time | Thumbnail | Dimensions | User | Comment | |
|---|---|---|---|---|---|
| current | 15:56, 6 June 2010 |
| 2,778 × 1,702 (426 KB) | Boghog | cropped |
| 15:24, 6 June 2010 |
 | 2,999 × 2,249 (523 KB) | Boghog | {{Information |Description={{en|1=Illustrations the time course of plasma drug concentrations over 36 hours, following administrations a drug every 12 hours. }} |Source={{own}} |Author= Boghog2 |Date=2010-06-06 |Permission= |other_versions |
File usage
The following pages on the English Wikipedia use this file (pages on other projects are not listed):
Size of this preview:
800 × 490 pixels. Other resolutions:
320 × 196 pixels |
640 × 392 pixels |
1,024 × 627 pixels |
1,280 × 784 pixels |
2,778 × 1,702 pixels.
Original file (2,778 × 1,702 pixels, file size: 426 KB, MIME type: image/png)
| This is a file from the
Wikimedia Commons. Information from its
description page there is shown below. Commons is a freely licensed media file repository. You can help. |
Summary
| Description |
English: Illustrations the time course of plasma drug concentrations over 36 hours, following administrations a drug every 12 hours. |
| Date | |
| Source | Own work |
| Author | Boghog2 |
Licensing
| I, the copyright holder of this work, release this work into the
public domain. This applies worldwide. In some countries this may not be legally possible; if so: I grant anyone the right to use this work for any purpose, without any conditions, unless such conditions are required by law. |
File history
Click on a date/time to view the file as it appeared at that time.
| Date/Time | Thumbnail | Dimensions | User | Comment | |
|---|---|---|---|---|---|
| current | 15:56, 6 June 2010 |
| 2,778 × 1,702 (426 KB) | Boghog | cropped |
| 15:24, 6 June 2010 |
| 2,999 × 2,249 (523 KB) | Boghog | {{Information |Description={{en|1=Illustrations the time course of plasma drug concentrations over 36 hours, following administrations a drug every 12 hours. }} |Source={{own}} |Author= Boghog2 |Date=2010-06-06 |Permission= |other_versions |
File usage
The following pages on the English Wikipedia use this file (pages on other projects are not listed):