Size of this preview:
748 × 599 pixels. Other resolutions:
300 × 240 pixels |
599 × 480 pixels |
760 × 609 pixels.
Original file (760 × 609 pixels, file size: 108 KB, MIME type: image/png)
| This is a file from the
Wikimedia Commons. Information from its
description page there is shown below. Commons is a freely licensed media file repository. You can help. |
Summary
| Description |
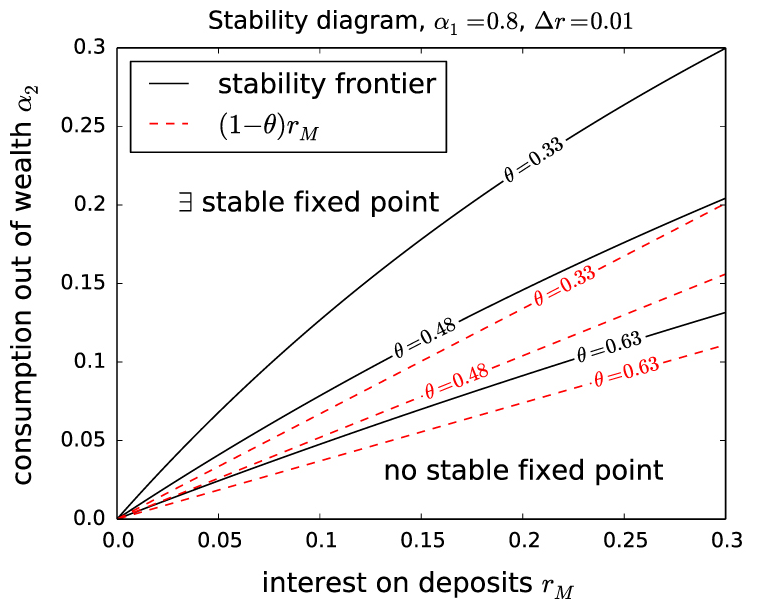
English: Stability analysis of the model for different tax rates. For a given interest rate rM, there exists a minimum consumption out of wealth α2 for which the model is stable. An increase in the tax rate θ reduces this threshold. If consumption out of wealth is smaller than interest income after taxes (as indicated by the red dashed lines), the fixed point will definitely be unstable, as inflows to households are always bigger than outflows for α1 < 1. |
| Date | |
| Source | Matthew Berg, Brian Hartley, Oliver Richters: A Stock-Flow Consistent Input-Output Model with Applications to Energy Price Shocks, Interest Rates, and Heat Emissions. In: New Journal of Physics, Vol. 17, no. 1, January 2015, Art. 015011, DOI:10.1088/1367-2630/17/1/015011. Image File. Article published under terms of the Creative Commons Attribution 3.0 licence. |
| Author | Matthew Berg, Brian Hartley, Oliver Richters |
Licensing
This file is licensed under the
Creative Commons
Attribution 3.0 Unported license.
- You are free:
- to share – to copy, distribute and transmit the work
- to remix – to adapt the work
- Under the following conditions:
- attribution – You must give appropriate credit, provide a link to the license, and indicate if changes were made. You may do so in any reasonable manner, but not in any way that suggests the licensor endorses you or your use.
File history
Click on a date/time to view the file as it appeared at that time.
| Date/Time | Thumbnail | Dimensions | User | Comment | |
|---|---|---|---|---|---|
| current | 21:25, 14 April 2020 |
| 760 × 609 (108 KB) | ElisaDodge | =={{int:filedesc}}== {{Information |description={{en|1=Stability analysis of the model for different tax rates. For a given interest rate r<sub>M</sub>, there exists a minimum consumption out of wealth α<sub>2</sub> for which the model is stable. An increase in the tax rate θ reduces this threshold. If consumption out of wealth is smaller than interest income after taxes (as indicated by the red dashed lines), the fixed point will definitely be unstable, as inflows to households are always bi... |
File usage
The following pages on the English Wikipedia use this file (pages on other projects are not listed):
Global file usage
The following other wikis use this file:
- Usage on de.wikipedia.org
Metadata
Size of this preview:
748 × 599 pixels. Other resolutions:
300 × 240 pixels |
599 × 480 pixels |
760 × 609 pixels.
Original file (760 × 609 pixels, file size: 108 KB, MIME type: image/png)
| This is a file from the
Wikimedia Commons. Information from its
description page there is shown below. Commons is a freely licensed media file repository. You can help. |
Summary
| Description |
English: Stability analysis of the model for different tax rates. For a given interest rate rM, there exists a minimum consumption out of wealth α2 for which the model is stable. An increase in the tax rate θ reduces this threshold. If consumption out of wealth is smaller than interest income after taxes (as indicated by the red dashed lines), the fixed point will definitely be unstable, as inflows to households are always bigger than outflows for α1 < 1. |
| Date | |
| Source | Matthew Berg, Brian Hartley, Oliver Richters: A Stock-Flow Consistent Input-Output Model with Applications to Energy Price Shocks, Interest Rates, and Heat Emissions. In: New Journal of Physics, Vol. 17, no. 1, January 2015, Art. 015011, DOI:10.1088/1367-2630/17/1/015011. Image File. Article published under terms of the Creative Commons Attribution 3.0 licence. |
| Author | Matthew Berg, Brian Hartley, Oliver Richters |
Licensing
This file is licensed under the
Creative Commons
Attribution 3.0 Unported license.
- You are free:
- to share – to copy, distribute and transmit the work
- to remix – to adapt the work
- Under the following conditions:
- attribution – You must give appropriate credit, provide a link to the license, and indicate if changes were made. You may do so in any reasonable manner, but not in any way that suggests the licensor endorses you or your use.
File history
Click on a date/time to view the file as it appeared at that time.
| Date/Time | Thumbnail | Dimensions | User | Comment | |
|---|---|---|---|---|---|
| current | 21:25, 14 April 2020 |
| 760 × 609 (108 KB) | ElisaDodge | =={{int:filedesc}}== {{Information |description={{en|1=Stability analysis of the model for different tax rates. For a given interest rate r<sub>M</sub>, there exists a minimum consumption out of wealth α<sub>2</sub> for which the model is stable. An increase in the tax rate θ reduces this threshold. If consumption out of wealth is smaller than interest income after taxes (as indicated by the red dashed lines), the fixed point will definitely be unstable, as inflows to households are always bi... |
File usage
The following pages on the English Wikipedia use this file (pages on other projects are not listed):
Global file usage
The following other wikis use this file:
- Usage on de.wikipedia.org