
Original file (SVG file, nominally 600 × 480 pixels, file size: 34 KB)
Summary
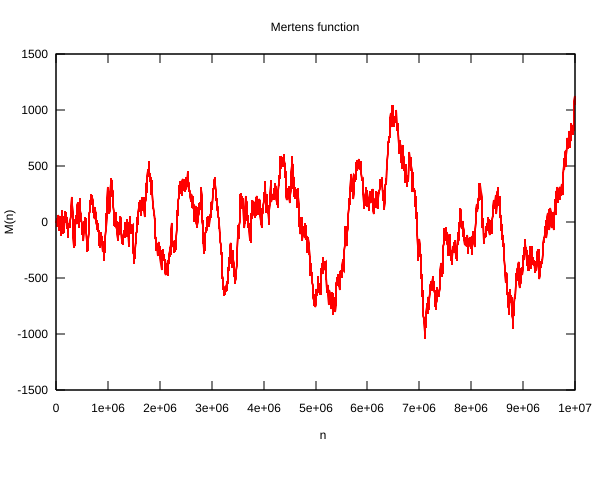
Graph of Mertens function for values of n from 1 to 10 million. Note the remarkably chaotic, unpredictable movement of this function.
See also

Licensing
Created by User:Linas, Linas Vepstas, 2 July 2006
 | Permission is granted to copy, distribute and/or modify this document under the terms of the GNU Free Documentation License, Version 1.2 or any later version published by the Free Software Foundation; with no Invariant Sections, no Front-Cover Texts, and no Back-Cover Texts. |
|
| This work is licensed under the
Creative Commons
Attribution-ShareAlike 3.0 License. This licensing tag was added to this file as part of the GFDL licensing update. |
Source code
Created with gnuplot, with the following markup:
set term svg
set out 'mertens.svg'

set data style lines
unset zeroaxis
set xtics border
set ytics border

set bmargin 5
set lmargin 7

set title "Mertens function"
set xlabel "n" 1,0
set ylabel "M(n)" 1, 0
plot "mertens.dat" using 1:2 title "" with lines linewidth 2
 | This file is a candidate to be copied to
Wikimedia Commons.
Any user may perform this transfer; refer to Wikipedia:Moving files to Commons for details. If this file has problems with attribution, copyright, or is otherwise ineligible for Commons, then remove this tag and DO NOT transfer it; repeat violators may be blocked from editing. Other Instructions
| ||
| |||
File history
Click on a date/time to view the file as it appeared at that time.
| Date/Time | Thumbnail | Dimensions | User | Comment | |
|---|---|---|---|---|---|
| current | 20:52, 2 July 2006 |
| 600 × 480 (34 KB) | Linas ( talk | contribs) | == Summary == Graph of Mertens function for values of ''n'' from 1 to 10,000. Note the remarkably chaotic, unpredictable movement of this function. == Licensing == Created by User:Linas, Linas Vepstas, 2 July 2006 {{GFDL-no-disclaimers}} ==Sou |
You cannot overwrite this file.
File usage
Metadata
Original file (SVG file, nominally 600 × 480 pixels, file size: 34 KB)
Summary
Graph of Mertens function for values of n from 1 to 10 million. Note the remarkably chaotic, unpredictable movement of this function.
See also
Licensing
Created by User:Linas, Linas Vepstas, 2 July 2006
|
| Permission is granted to copy, distribute and/or modify this document under the terms of the GNU Free Documentation License, Version 1.2 or any later version published by the Free Software Foundation; with no Invariant Sections, no Front-Cover Texts, and no Back-Cover Texts. |
|
| This work is licensed under the
Creative Commons
Attribution-ShareAlike 3.0 License. This licensing tag was added to this file as part of the GFDL licensing update. |
Source code
Created with gnuplot, with the following markup:
set term svg
set out 'mertens.svg'

set data style lines
unset zeroaxis
set xtics border
set ytics border

set bmargin 5
set lmargin 7

set title "Mertens function"
set xlabel "n" 1,0
set ylabel "M(n)" 1, 0
plot "mertens.dat" using 1:2 title "" with lines linewidth 2
|
| This file is a candidate to be copied to
Wikimedia Commons.
Any user may perform this transfer; refer to Wikipedia:Moving files to Commons for details. If this file has problems with attribution, copyright, or is otherwise ineligible for Commons, then remove this tag and DO NOT transfer it; repeat violators may be blocked from editing. Other Instructions
| ||
| |||
File history
Click on a date/time to view the file as it appeared at that time.
| Date/Time | Thumbnail | Dimensions | User | Comment | |
|---|---|---|---|---|---|
| current | 20:52, 2 July 2006 |
| 600 × 480 (34 KB) | Linas ( talk | contribs) | == Summary == Graph of Mertens function for values of ''n'' from 1 to 10,000. Note the remarkably chaotic, unpredictable movement of this function. == Licensing == Created by User:Linas, Linas Vepstas, 2 July 2006 {{GFDL-no-disclaimers}} ==Sou |
You cannot overwrite this file.