
Size of this preview:
650 × 599 pixels. Other resolutions:
260 × 240 pixels |
521 × 480 pixels |
833 × 768 pixels |
1,110 × 1,024 pixels |
2,221 × 2,048 pixels |
2,700 × 2,490 pixels.
Original file (2,700 × 2,490 pixels, file size: 2.08 MB, MIME type: image/png)
| This is a file from the
Wikimedia Commons. Information from its
description page there is shown below. Commons is a freely licensed media file repository. You can help. |
Summary
| Description |
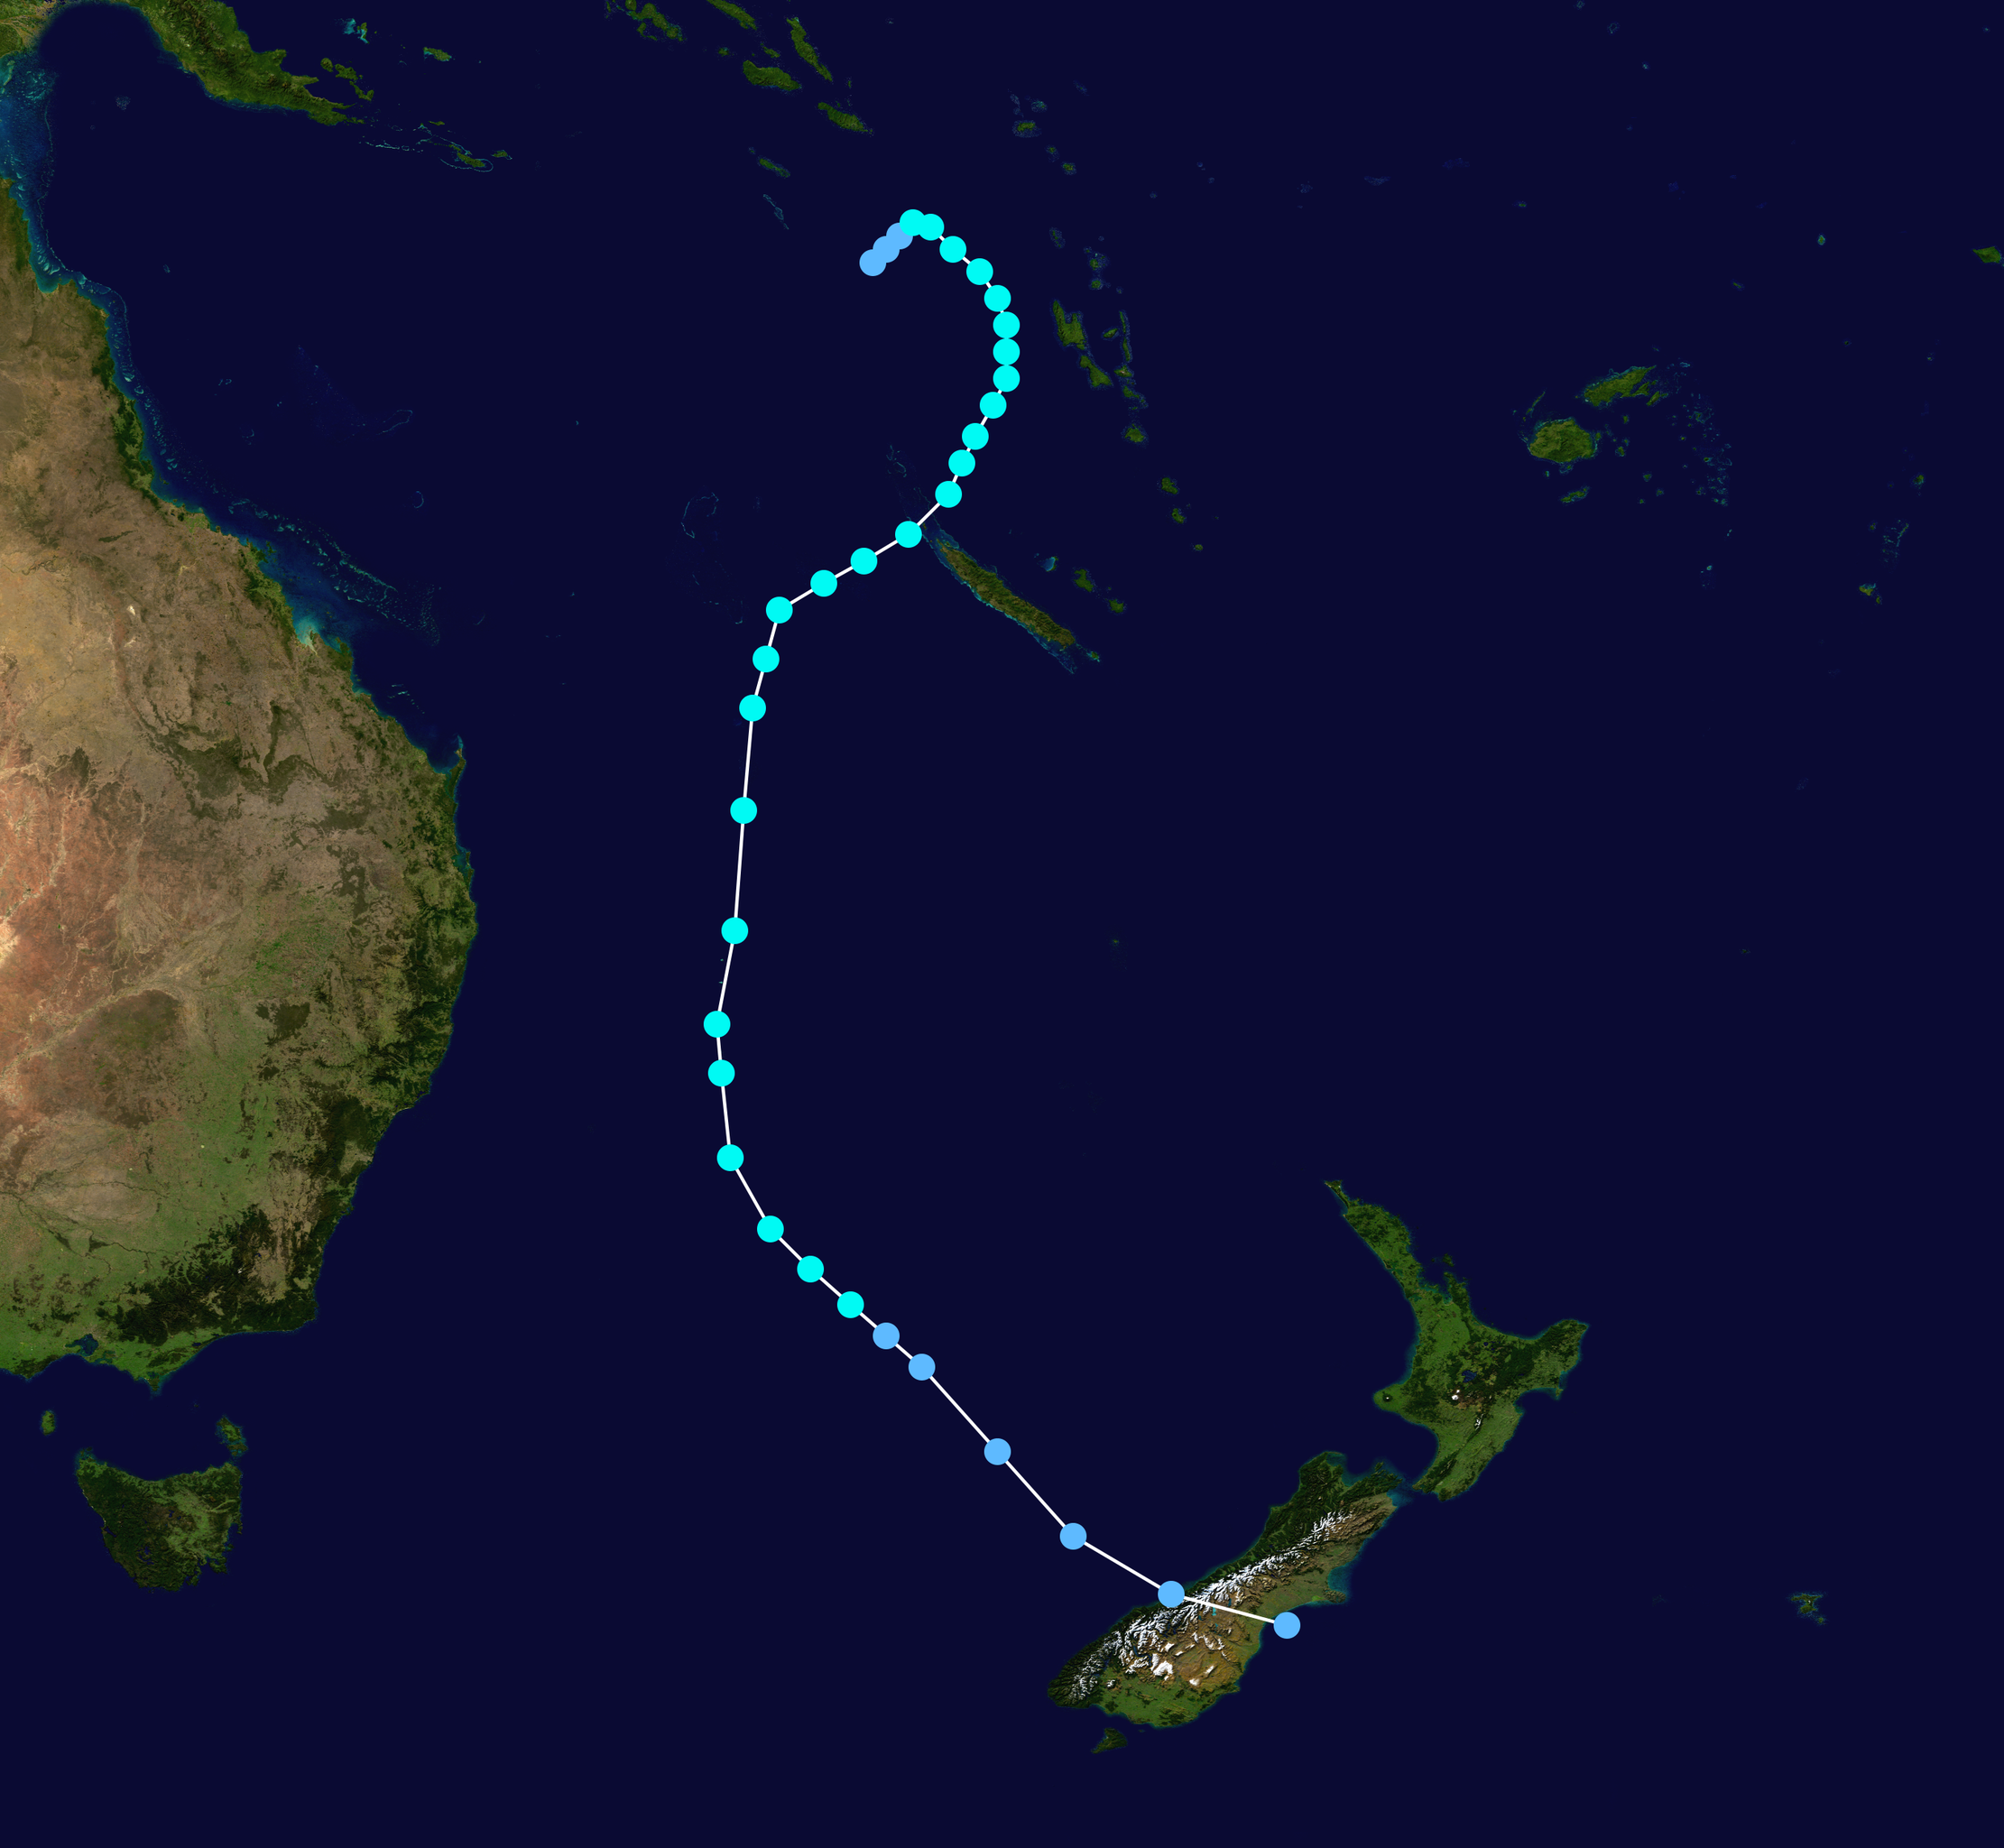
English: Track map of Tropical Cyclone Isis of the 1960-61 South Pacific cyclone season. The points show the location of the storm at 6-hour intervals. The colour represents the storm's
maximum sustained wind speeds as classified in the Saffir-Simpson Hurricane Scale (see below), and the shape of the data points represent the nature of the storm, according to the legend below.
Tropical depression (≤38 mph, ≤62 km/h)
Tropical storm (39–73 mph, 63–118 km/h)
Category 1 (74–95 mph, 119–153 km/h)
Category 2 (96–110 mph, 154–177 km/h)
Category 3 (111–129 mph, 178–208 km/h)
Category 4 (130–156 mph, 209–251 km/h)
Category 5 (≥157 mph, ≥252 km/h)
Unknown
Storm type |
| Date | |
| Source | Created by Anhamirak using Wikipedia:WikiProject Tropical cyclones/Tracks. The background image is from NASA. Tracking data is from the Joint Typhoon Warning Center. |
| Author | Anhamirak |
Licensing
I, the copyright holder of this work, hereby publish it under the following licenses:
This file is licensed under the
Creative Commons
Attribution-Share Alike 3.0 Unported license.
- You are free:
- to share – to copy, distribute and transmit the work
- to remix – to adapt the work
- Under the following conditions:
- attribution – You must give appropriate credit, provide a link to the license, and indicate if changes were made. You may do so in any reasonable manner, but not in any way that suggests the licensor endorses you or your use.
- share alike – If you remix, transform, or build upon the material, you must distribute your contributions under the same or compatible license as the original.

|
Permission is granted to copy, distribute and/or modify this document under the terms of the GNU Free Documentation License, Version 1.2 or any later version published by the Free Software Foundation; with no Invariant Sections, no Front-Cover Texts, and no Back-Cover Texts. A copy of the license is included in the section entitled GNU Free Documentation License. |
You may select the license of your choice.
File history
Click on a date/time to view the file as it appeared at that time.
| Date/Time | Thumbnail | Dimensions | User | Comment | |
|---|---|---|---|---|---|
| current | 19:41, 10 June 2013 |
| 2,700 × 2,490 (2.08 MB) | Supportstorm | Neumann data |
| 16:07, 29 July 2010 |
 | 1,024 × 935 (370 KB) | Iune | updated with 1-minute winds as per SSHS | |
| 16:04, 29 July 2010 |
 | 1,024 × 935 (370 KB) | Iune | {{Information |Description={{en|1={{Information |Description={{en|Track map of Severe Tropical Cyclone Giselle of the 1967-68 South Pacific cyclone season. The points show the location of the storm at 6-hour intervals. The colour represents the storm's [[ |
File usage
The following pages on the English Wikipedia use this file (pages on other projects are not listed):
Size of this preview:
650 × 599 pixels. Other resolutions:
260 × 240 pixels |
521 × 480 pixels |
833 × 768 pixels |
1,110 × 1,024 pixels |
2,221 × 2,048 pixels |
2,700 × 2,490 pixels.
Original file (2,700 × 2,490 pixels, file size: 2.08 MB, MIME type: image/png)
| This is a file from the
Wikimedia Commons. Information from its
description page there is shown below. Commons is a freely licensed media file repository. You can help. |
Summary
| Description |
English: Track map of Tropical Cyclone Isis of the 1960-61 South Pacific cyclone season. The points show the location of the storm at 6-hour intervals. The colour represents the storm's
maximum sustained wind speeds as classified in the Saffir-Simpson Hurricane Scale (see below), and the shape of the data points represent the nature of the storm, according to the legend below.
Tropical depression (≤38 mph, ≤62 km/h)
Tropical storm (39–73 mph, 63–118 km/h)
Category 1 (74–95 mph, 119–153 km/h)
Category 2 (96–110 mph, 154–177 km/h)
Category 3 (111–129 mph, 178–208 km/h)
Category 4 (130–156 mph, 209–251 km/h)
Category 5 (≥157 mph, ≥252 km/h)
Unknown
Storm type |
| Date | |
| Source | Created by Anhamirak using Wikipedia:WikiProject Tropical cyclones/Tracks. The background image is from NASA. Tracking data is from the Joint Typhoon Warning Center. |
| Author | Anhamirak |
Licensing
I, the copyright holder of this work, hereby publish it under the following licenses:
This file is licensed under the
Creative Commons
Attribution-Share Alike 3.0 Unported license.
- You are free:
- to share – to copy, distribute and transmit the work
- to remix – to adapt the work
- Under the following conditions:
- attribution – You must give appropriate credit, provide a link to the license, and indicate if changes were made. You may do so in any reasonable manner, but not in any way that suggests the licensor endorses you or your use.
- share alike – If you remix, transform, or build upon the material, you must distribute your contributions under the same or compatible license as the original.
|
|
Permission is granted to copy, distribute and/or modify this document under the terms of the GNU Free Documentation License, Version 1.2 or any later version published by the Free Software Foundation; with no Invariant Sections, no Front-Cover Texts, and no Back-Cover Texts. A copy of the license is included in the section entitled GNU Free Documentation License. |
You may select the license of your choice.
File history
Click on a date/time to view the file as it appeared at that time.
| Date/Time | Thumbnail | Dimensions | User | Comment | |
|---|---|---|---|---|---|
| current | 19:41, 10 June 2013 |
| 2,700 × 2,490 (2.08 MB) | Supportstorm | Neumann data |
| 16:07, 29 July 2010 |
| 1,024 × 935 (370 KB) | Iune | updated with 1-minute winds as per SSHS | |
| 16:04, 29 July 2010 |
| 1,024 × 935 (370 KB) | Iune | {{Information |Description={{en|1={{Information |Description={{en|Track map of Severe Tropical Cyclone Giselle of the 1967-68 South Pacific cyclone season. The points show the location of the storm at 6-hour intervals. The colour represents the storm's [[ |
File usage
The following pages on the English Wikipedia use this file (pages on other projects are not listed):