
Size of this PNG preview of this SVG file:
400 × 400 pixels. Other resolutions:
240 × 240 pixels |
480 × 480 pixels |
768 × 768 pixels |
1,024 × 1,024 pixels |
2,048 × 2,048 pixels.
Original file (SVG file, nominally 400 × 400 pixels, file size: 7 KB)
| This is a file from the
Wikimedia Commons. Information from its
description page there is shown below. Commons is a freely licensed media file repository. You can help. |
Summary
| Description |
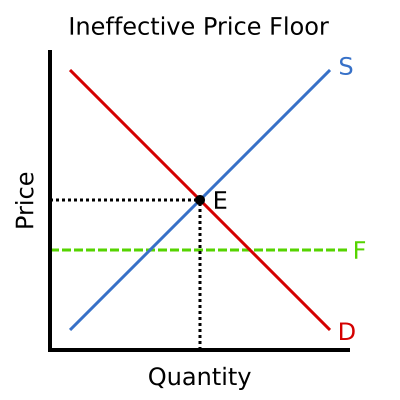
English: An illustrative supply/demand graph, showing an ineffective price floor (below equilibrium price). Line D (red) represents the demand (price vs. quantity demanded), line S (blue) represents the supply (price vs. quantity supplied), point E (black) is the equilibrium point, and line F (green, dashed) represents the price floor. |
||
| Date | |||
| Source | Own work, based on Image:Basic price floor.png | ||
| Author | Kbolino ( talk) | ||
| Permission ( Reusing this file) |
|
Original upload log
The original description page was
here. All following user names refer to en.wikipedia.
- 2008-09-14 08:09 Kbolino 400×400× (7670 bytes) {{Information |Description=An illustrative supply/demand curve, showing an ineffective price floor (below equilibrium price). |Source=Own work, based on [[Image:Basic price floor.png]] |Date=14 September 2008 |Author=~~~ |other_versions= }}
File history
Click on a date/time to view the file as it appeared at that time.
| Date/Time | Thumbnail | Dimensions | User | Comment | |
|---|---|---|---|---|---|
| current | 09:48, 17 March 2014 |
| 400 × 400 (7 KB) | Wolfch | {{Information |Description=An illustrative supply/demand graph, showing an ineffective price floor (below equilibrium price). Line D (red) represents the demand (price vs. quantity demanded), line S (blue) represents the supply (price vs. quantity supp... |
File usage
The following pages on the English Wikipedia use this file (pages on other projects are not listed):
Global file usage
The following other wikis use this file:
- Usage on el.wikipedia.org
- Usage on et.wikipedia.org
- Usage on zh.wikipedia.org
Metadata
Size of this PNG preview of this SVG file:
400 × 400 pixels. Other resolutions:
240 × 240 pixels |
480 × 480 pixels |
768 × 768 pixels |
1,024 × 1,024 pixels |
2,048 × 2,048 pixels.
Original file (SVG file, nominally 400 × 400 pixels, file size: 7 KB)
| This is a file from the
Wikimedia Commons. Information from its
description page there is shown below. Commons is a freely licensed media file repository. You can help. |
Summary
| Description |
English: An illustrative supply/demand graph, showing an ineffective price floor (below equilibrium price). Line D (red) represents the demand (price vs. quantity demanded), line S (blue) represents the supply (price vs. quantity supplied), point E (black) is the equilibrium point, and line F (green, dashed) represents the price floor. |
||
| Date | |||
| Source | Own work, based on Image:Basic price floor.png | ||
| Author | Kbolino ( talk) | ||
| Permission ( Reusing this file) |
|
Original upload log
The original description page was
here. All following user names refer to en.wikipedia.
- 2008-09-14 08:09 Kbolino 400×400× (7670 bytes) {{Information |Description=An illustrative supply/demand curve, showing an ineffective price floor (below equilibrium price). |Source=Own work, based on [[Image:Basic price floor.png]] |Date=14 September 2008 |Author=~~~ |other_versions= }}
File history
Click on a date/time to view the file as it appeared at that time.
| Date/Time | Thumbnail | Dimensions | User | Comment | |
|---|---|---|---|---|---|
| current | 09:48, 17 March 2014 |
| 400 × 400 (7 KB) | Wolfch | {{Information |Description=An illustrative supply/demand graph, showing an ineffective price floor (below equilibrium price). Line D (red) represents the demand (price vs. quantity demanded), line S (blue) represents the supply (price vs. quantity supp... |
File usage
The following pages on the English Wikipedia use this file (pages on other projects are not listed):
Global file usage
The following other wikis use this file:
- Usage on el.wikipedia.org
- Usage on et.wikipedia.org
- Usage on zh.wikipedia.org