
Size of this PNG preview of this SVG file:
600 × 400 pixels. Other resolutions:
320 × 213 pixels |
640 × 427 pixels |
1,024 × 683 pixels |
1,280 × 853 pixels |
2,560 × 1,707 pixels.
Original file (SVG file, nominally 600 × 400 pixels, file size: 13 KB)
| This is a file from the
Wikimedia Commons. Information from its
description page there is shown below. Commons is a freely licensed media file repository. You can help. |
Summary
| Description |
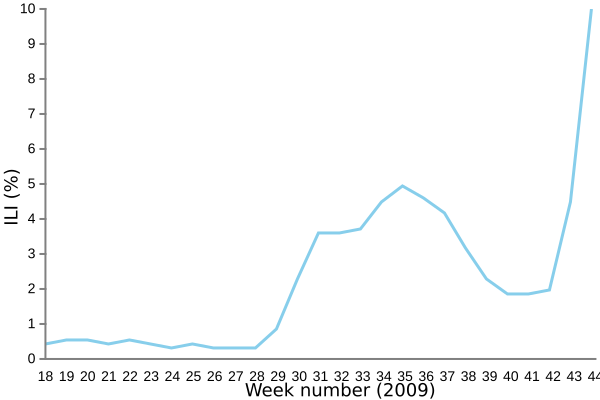
English: A graph of influensa-like illness as a percentage of all doctor contacts in the Norwegian governments influenza sentinel system from week 18 (Early May) to week 44 (late October), 2009. The sentinel system is a collection of 201 general practices that report the percentage of influensa-like illness as a percentage of all doctor contacts. These practices are spread out over the whole country and represent about 15% of the population. |
| Date | |
| Source | Own work |
| Author | Janbrogger |
The data in this chart are taken from the Norwegian Public Health Institute update on influenza surveillance on November 4th, 2009, at: [1] archive copy at the Wayback Machine
Licensing
| I, the copyright holder of this work, release this work into the
public domain. This applies worldwide. In some countries this may not be legally possible; if so: I grant anyone the right to use this work for any purpose, without any conditions, unless such conditions are required by law. |
File history
Click on a date/time to view the file as it appeared at that time.
| Date/Time | Thumbnail | Dimensions | User | Comment | |
|---|---|---|---|---|---|
| current | 14:55, 6 November 2009 |
| 600 × 400 (13 KB) | Janbrogger | Trying to fix blackened text |
| 14:52, 6 November 2009 |
 | 600 × 400 (14 KB) | Janbrogger | Fixed "blackened" text | |
| 14:32, 6 November 2009 |
 | 600 × 400 (13 KB) | Janbrogger | Added axis labels. | |
| 14:31, 6 November 2009 |
 | 600 × 400 (8 KB) | Janbrogger | {{Information |Description={{en|1=A graph of influensa-like illness as a percentage of all doctor contacts in the Norwegian governments influenza sentinel system from week 18 (Early May) to week 44 (late October), 2009. The sentinel system is a collection |
File usage
The following pages on the English Wikipedia use this file (pages on other projects are not listed):
Size of this PNG preview of this SVG file:
600 × 400 pixels. Other resolutions:
320 × 213 pixels |
640 × 427 pixels |
1,024 × 683 pixels |
1,280 × 853 pixels |
2,560 × 1,707 pixels.
Original file (SVG file, nominally 600 × 400 pixels, file size: 13 KB)
| This is a file from the
Wikimedia Commons. Information from its
description page there is shown below. Commons is a freely licensed media file repository. You can help. |
Summary
| Description |
English: A graph of influensa-like illness as a percentage of all doctor contacts in the Norwegian governments influenza sentinel system from week 18 (Early May) to week 44 (late October), 2009. The sentinel system is a collection of 201 general practices that report the percentage of influensa-like illness as a percentage of all doctor contacts. These practices are spread out over the whole country and represent about 15% of the population. |
| Date | |
| Source | Own work |
| Author | Janbrogger |
The data in this chart are taken from the Norwegian Public Health Institute update on influenza surveillance on November 4th, 2009, at: [1] archive copy at the Wayback Machine
Licensing
| I, the copyright holder of this work, release this work into the
public domain. This applies worldwide. In some countries this may not be legally possible; if so: I grant anyone the right to use this work for any purpose, without any conditions, unless such conditions are required by law. |
File history
Click on a date/time to view the file as it appeared at that time.
| Date/Time | Thumbnail | Dimensions | User | Comment | |
|---|---|---|---|---|---|
| current | 14:55, 6 November 2009 |
| 600 × 400 (13 KB) | Janbrogger | Trying to fix blackened text |
| 14:52, 6 November 2009 |
| 600 × 400 (14 KB) | Janbrogger | Fixed "blackened" text | |
| 14:32, 6 November 2009 |
| 600 × 400 (13 KB) | Janbrogger | Added axis labels. | |
| 14:31, 6 November 2009 |
| 600 × 400 (8 KB) | Janbrogger | {{Information |Description={{en|1=A graph of influensa-like illness as a percentage of all doctor contacts in the Norwegian governments influenza sentinel system from week 18 (Early May) to week 44 (late October), 2009. The sentinel system is a collection |
File usage
The following pages on the English Wikipedia use this file (pages on other projects are not listed):