
Original file (SVG file, nominally 552 × 227 pixels, file size: 25 KB)
| This is a file from the
Wikimedia Commons. Information from its
description page there is shown below. Commons is a freely licensed media file repository. You can help. |
Summary
| Description |
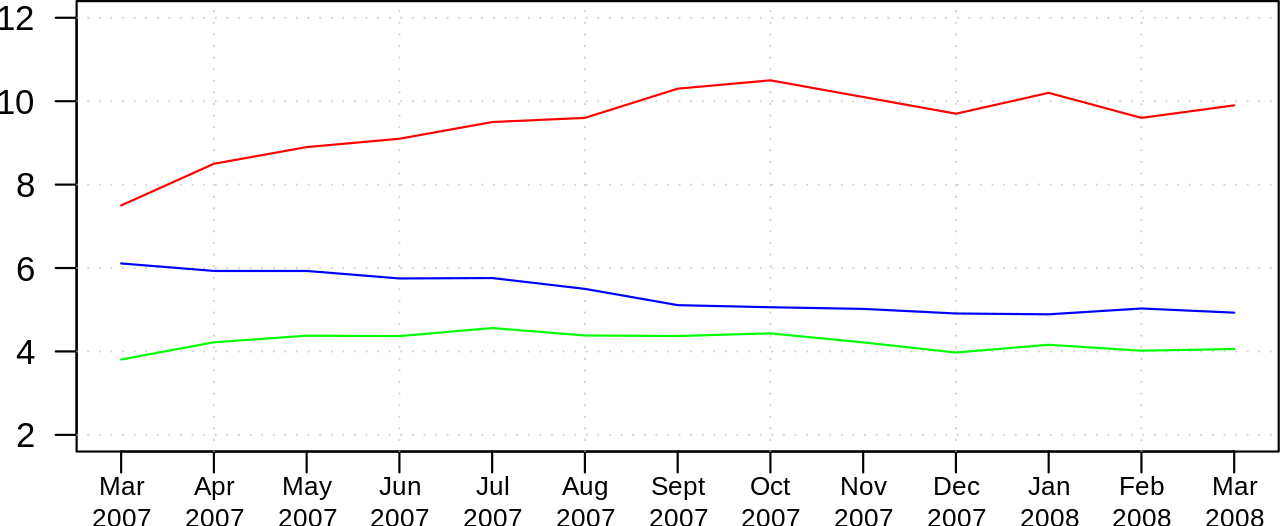
English: The red line is the average time to sale, in months.
The blue line is the number of homes sold, in millions. The green line is the inventory of unsold homes, in millions. |
| Source |
http://en.wikipedia.org/wiki/Image:Existing_Home_Sales_Chart_-_v_1.0.png This data is from the National Association of Realtors. They release a monthly "Existing Home Sales" press release with these statistics. In addition, they have an annual summary spreadsheet for 2007 which I retrieved 2/6/08. Some of the data in this spreadsheet differs from the data in their monthly press release. The figures for sales of homes are annualized rates for the month indicated (e.g., sales for the month multiplied by 12, I assume). Inventory data is as of that point in time. These are NOT quarterly figures; I simply picked quarter-ending months. Below is a typical reference for one of their monthly press releases [1] and for the spreadsheet summary. [2] |
| Author | Emok |
date<-c("\nMar\n2007","\nApr\n2007","\nMay\n2007","\nJun\n2007","\nJul\n2007","\nAug\n2007","\nSept\n2007","\nOct\n2007","\nNov\n2007","\nDec\n2007","\nJan\n2008","\nFeb\n2008","\nMar\n2008")
supply<-c(7.5,8.5,8.9,9.1,9.5,9.6,10.3,10.5,10.1,9.7,10.2,9.6,9.9)
sales<-c(6.11,5.93,5.93,5.75,5.76,5.5,5.11,5.06,5.02,4.91,4.89,5.03,4.93)
inventory<-c(3.806,4.220,4.378,4.368,4.561,4.383,4.370,4.433,4.217,3.974,4.16,4.018,4.058)
pdf('sales.pdf', width=7, height=4)
plot(seq(13),supply, type='n', ylim=c(2,12), xaxt='n', ylab=NA, xlab=NA,las=1)
axis(1, seq(13), date, cex.axis=0.75)
grid()
lines(seq(13), supply, col='red')
lines(seq(13), sales, col='blue')
lines(seq(13), inventory, col='green')
dev.off()
References
- ↑ NAR: Existing-home Sales Down in December but 2007 was Fifth Highest on Record
- ↑ http://www.realtor.org/Research.nsf/files/EHSreport.pdf/$FILE/EHSreport.pdf
Licensing
- You are free:
- to share – to copy, distribute and transmit the work
- to remix – to adapt the work
- Under the following conditions:
- attribution – You must give appropriate credit, provide a link to the license, and indicate if changes were made. You may do so in any reasonable manner, but not in any way that suggests the licensor endorses you or your use.
- share alike – If you remix, transform, or build upon the material, you must distribute your contributions under the same or compatible license as the original.

|
Permission is granted to copy, distribute and/or modify this document under the terms of the GNU Free Documentation License, Version 1.2 or any later version published by the Free Software Foundation; with no Invariant Sections, no Front-Cover Texts, and no Back-Cover Texts. A copy of the license is included in the section entitled GNU Free Documentation License. |
File history
Click on a date/time to view the file as it appeared at that time.
| Date/Time | Thumbnail | Dimensions | User | Comment | |
|---|---|---|---|---|---|
| current | 22:23, 24 September 2008 |
| 552 × 227 (25 KB) | Emok | {{Information |Description={{en|1=The red line is the average time to sale, in months. The blue line is the number of homes sold, in millions. The green line is the inventory of unsold homes, in millions. }} |Source=http://en.wikipedia.org/wiki/Image:Exis |
File usage
Original file (SVG file, nominally 552 × 227 pixels, file size: 25 KB)
| This is a file from the
Wikimedia Commons. Information from its
description page there is shown below. Commons is a freely licensed media file repository. You can help. |
Summary
| Description |
English: The red line is the average time to sale, in months.
The blue line is the number of homes sold, in millions. The green line is the inventory of unsold homes, in millions. |
| Source |
http://en.wikipedia.org/wiki/Image:Existing_Home_Sales_Chart_-_v_1.0.png This data is from the National Association of Realtors. They release a monthly "Existing Home Sales" press release with these statistics. In addition, they have an annual summary spreadsheet for 2007 which I retrieved 2/6/08. Some of the data in this spreadsheet differs from the data in their monthly press release. The figures for sales of homes are annualized rates for the month indicated (e.g., sales for the month multiplied by 12, I assume). Inventory data is as of that point in time. These are NOT quarterly figures; I simply picked quarter-ending months. Below is a typical reference for one of their monthly press releases [1] and for the spreadsheet summary. [2] |
| Author | Emok |
date<-c("\nMar\n2007","\nApr\n2007","\nMay\n2007","\nJun\n2007","\nJul\n2007","\nAug\n2007","\nSept\n2007","\nOct\n2007","\nNov\n2007","\nDec\n2007","\nJan\n2008","\nFeb\n2008","\nMar\n2008")
supply<-c(7.5,8.5,8.9,9.1,9.5,9.6,10.3,10.5,10.1,9.7,10.2,9.6,9.9)
sales<-c(6.11,5.93,5.93,5.75,5.76,5.5,5.11,5.06,5.02,4.91,4.89,5.03,4.93)
inventory<-c(3.806,4.220,4.378,4.368,4.561,4.383,4.370,4.433,4.217,3.974,4.16,4.018,4.058)
pdf('sales.pdf', width=7, height=4)
plot(seq(13),supply, type='n', ylim=c(2,12), xaxt='n', ylab=NA, xlab=NA,las=1)
axis(1, seq(13), date, cex.axis=0.75)
grid()
lines(seq(13), supply, col='red')
lines(seq(13), sales, col='blue')
lines(seq(13), inventory, col='green')
dev.off()
References
- ↑ NAR: Existing-home Sales Down in December but 2007 was Fifth Highest on Record
- ↑ http://www.realtor.org/Research.nsf/files/EHSreport.pdf/$FILE/EHSreport.pdf
Licensing
- You are free:
- to share – to copy, distribute and transmit the work
- to remix – to adapt the work
- Under the following conditions:
- attribution – You must give appropriate credit, provide a link to the license, and indicate if changes were made. You may do so in any reasonable manner, but not in any way that suggests the licensor endorses you or your use.
- share alike – If you remix, transform, or build upon the material, you must distribute your contributions under the same or compatible license as the original.
|
|
Permission is granted to copy, distribute and/or modify this document under the terms of the GNU Free Documentation License, Version 1.2 or any later version published by the Free Software Foundation; with no Invariant Sections, no Front-Cover Texts, and no Back-Cover Texts. A copy of the license is included in the section entitled GNU Free Documentation License. |
File history
Click on a date/time to view the file as it appeared at that time.
| Date/Time | Thumbnail | Dimensions | User | Comment | |
|---|---|---|---|---|---|
| current | 22:23, 24 September 2008 |
| 552 × 227 (25 KB) | Emok | {{Information |Description={{en|1=The red line is the average time to sale, in months. The blue line is the number of homes sold, in millions. The green line is the inventory of unsold homes, in millions. }} |Source=http://en.wikipedia.org/wiki/Image:Exis |