Size of this preview:
792 × 599 pixels. Other resolutions:
317 × 240 pixels |
635 × 480 pixels |
1,015 × 768 pixels |
1,280 × 968 pixels |
1,660 × 1,256 pixels.
Original file (1,660 × 1,256 pixels, file size: 136 KB, MIME type: image/png)
| This is a file from the
Wikimedia Commons. Information from its
description page there is shown below. Commons is a freely licensed media file repository. You can help. |
Summary
| Description |
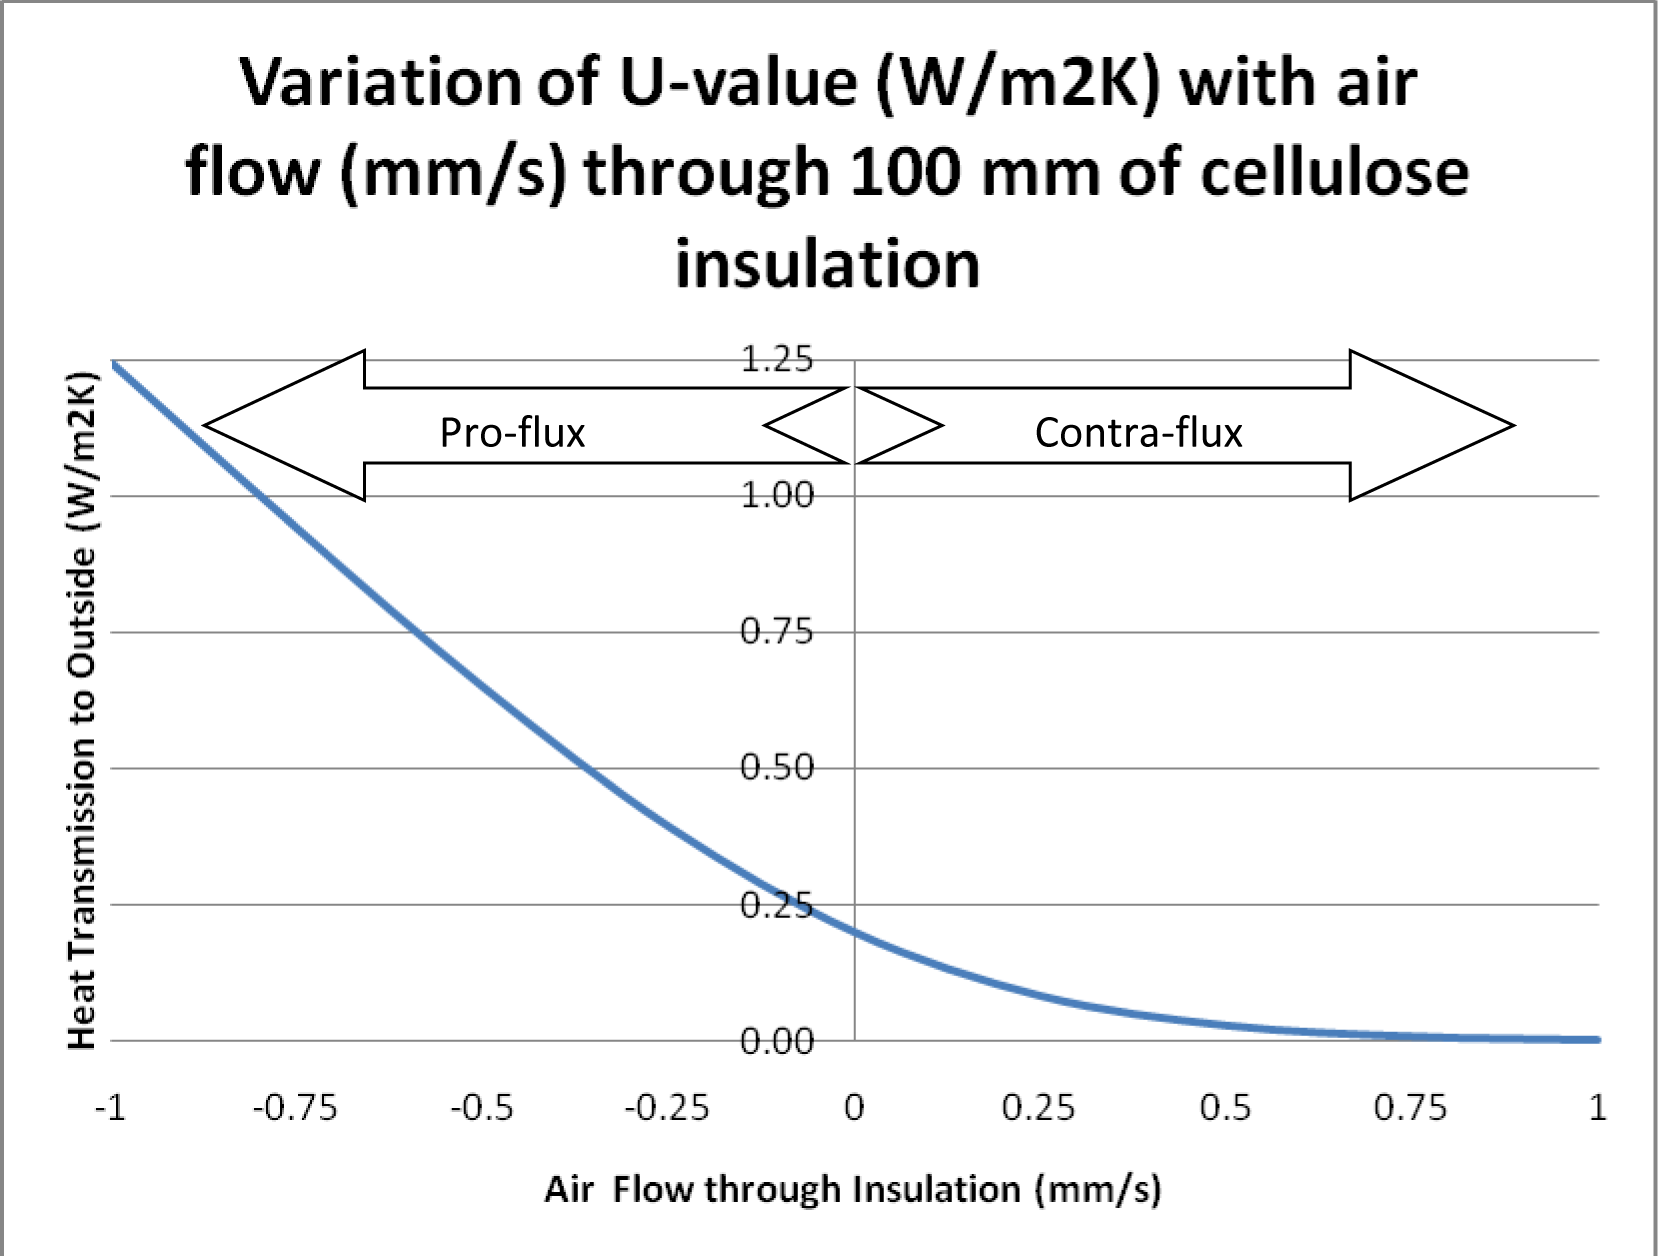
English: Graph showing how U-value of dynamic insulation varies with air speed. |
| Date | created 26. March. 2011 |
| Source | self-made |
| Author | Bruce Taylor Ecurb Rolyat ( talk), Robert Gordon University |
| Permission ( Reusing this file) |
Released under the This file is licensed under the
Creative Commons
Attribution-Share Alike 3.0 Unported license.
|
Licensing
I, the copyright holder of this work, hereby publish it under the following license:
This file is licensed under the
Creative Commons
Attribution-Share Alike 3.0 Unported license.
- You are free:
- to share – to copy, distribute and transmit the work
- to remix – to adapt the work
- Under the following conditions:
- attribution – You must give appropriate credit, provide a link to the license, and indicate if changes were made. You may do so in any reasonable manner, but not in any way that suggests the licensor endorses you or your use.
- share alike – If you remix, transform, or build upon the material, you must distribute your contributions under the same or compatible license as the original.
File history
Click on a date/time to view the file as it appeared at that time.
| Date/Time | Thumbnail | Dimensions | User | Comment | |
|---|---|---|---|---|---|
| current | 16:00, 31 March 2011 |
| 1,660 × 1,256 (136 KB) | Ecurb Rolyat | {{Information |Description = Graph showing how U-value of dynamic insulation varies with air speed. |Source = self-made |Date = created 26. March. 2011 |Author = Bruce Taylor~~~, Robert Gordon University |Permission = Released under the {{Cc-by-sa-3.0}} | |
File usage
The following pages on the English Wikipedia use this file (pages on other projects are not listed):
Metadata
Size of this preview:
792 × 599 pixels. Other resolutions:
317 × 240 pixels |
635 × 480 pixels |
1,015 × 768 pixels |
1,280 × 968 pixels |
1,660 × 1,256 pixels.
Original file (1,660 × 1,256 pixels, file size: 136 KB, MIME type: image/png)
| This is a file from the
Wikimedia Commons. Information from its
description page there is shown below. Commons is a freely licensed media file repository. You can help. |
Summary
| Description |
English: Graph showing how U-value of dynamic insulation varies with air speed. |
| Date | created 26. March. 2011 |
| Source | self-made |
| Author | Bruce Taylor Ecurb Rolyat ( talk), Robert Gordon University |
| Permission ( Reusing this file) |
Released under the This file is licensed under the
Creative Commons
Attribution-Share Alike 3.0 Unported license.
|
Licensing
I, the copyright holder of this work, hereby publish it under the following license:
This file is licensed under the
Creative Commons
Attribution-Share Alike 3.0 Unported license.
- You are free:
- to share – to copy, distribute and transmit the work
- to remix – to adapt the work
- Under the following conditions:
- attribution – You must give appropriate credit, provide a link to the license, and indicate if changes were made. You may do so in any reasonable manner, but not in any way that suggests the licensor endorses you or your use.
- share alike – If you remix, transform, or build upon the material, you must distribute your contributions under the same or compatible license as the original.
File history
Click on a date/time to view the file as it appeared at that time.
| Date/Time | Thumbnail | Dimensions | User | Comment | |
|---|---|---|---|---|---|
| current | 16:00, 31 March 2011 |
| 1,660 × 1,256 (136 KB) | Ecurb Rolyat | {{Information |Description = Graph showing how U-value of dynamic insulation varies with air speed. |Source = self-made |Date = created 26. March. 2011 |Author = Bruce Taylor~~~, Robert Gordon University |Permission = Released under the {{Cc-by-sa-3.0}} | |
File usage
The following pages on the English Wikipedia use this file (pages on other projects are not listed):