
Size of this PNG preview of this SVG file:
800 × 574 pixels. Other resolutions:
320 × 230 pixels |
640 × 459 pixels |
1,024 × 734 pixels |
1,280 × 918 pixels |
2,560 × 1,836 pixels |
884 × 634 pixels.
Original file (SVG file, nominally 884 × 634 pixels, file size: 2 KB)
| This is a file from the
Wikimedia Commons. Information from its
description page there is shown below. Commons is a freely licensed media file repository. You can help. |
Summary
| Description |
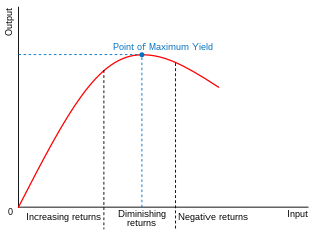
English: The graph highlights the concept of diminishing returns by plotting the curve of output against input. The areas of increasing, diminishing and negative returns are identified at points along the curve. There is also a point of maximum yield which is the point on the curve where producing another unit of output becomes inefficient and unproductive.
తెలుగు: తగ్గుతున్న రిటర్న్స్ గ్రాఫ్ఇన్పుట్కు వ్యతిరేకంగా అవుట్ పుట్ యొక్క వక్రతను గుర్తించడం ద్వారా రాబడిని తగ్గించే భావనను గ్రాఫ్ హైలైట్ చేస్తుంది.
فارسی: نمودار بازده نزولی که در آن سه ناحیهٔ بازده افزایشی، بیشینهٔ بازده، و کاهش بازده نشان داده شدهاند. |
| Date | 22 April 2021 (original upload date) |
| Source | Own work based on: Diminishing Returns Graph.png by Happyavocado |
| Author | Vectorization: Alhadis |
| SVG development |

|
|
This file supersedes the file
Diminishing Returns Graph.png. It is recommended to use this file rather than the other one.
|
|
Licensing
This file is licensed under the
Creative Commons
Attribution-Share Alike 4.0 International license.
Attribution: Happyavocado
- You are free:
- to share – to copy, distribute and transmit the work
- to remix – to adapt the work
- Under the following conditions:
- attribution – You must give appropriate credit, provide a link to the license, and indicate if changes were made. You may do so in any reasonable manner, but not in any way that suggests the licensor endorses you or your use.
- share alike – If you remix, transform, or build upon the material, you must distribute your contributions under the same or compatible license as the original.
File history
Click on a date/time to view the file as it appeared at that time.
| Date/Time | Thumbnail | Dimensions | User | Comment | |
|---|---|---|---|---|---|
| current | 18:55, 31 July 2022 |
| 884 × 634 (2 KB) | Alhadis | == {{int:filedesc}} == {{Information | Description = {{en|The graph highlights the concept of diminishing returns by plotting the curve of output against input. The areas of increasing, diminishing and negative returns are identified at points along the curve. There is also a point of maximum yield which is the point on the curve where producing another unit of output becomes inefficient and unproductive.}} | Source = {{Own based|Diminishing Returns Graph.png|by=Happyavocado}} | Date = {{Orig... |
File usage
The following pages on the English Wikipedia use this file (pages on other projects are not listed):
Global file usage
The following other wikis use this file:
- Usage on az.wikipedia.org
- Usage on fa.wikipedia.org
- Usage on is.wikipedia.org
- Usage on sv.wikipedia.org
- Usage on te.wikipedia.org
Metadata
Size of this PNG preview of this SVG file:
800 × 574 pixels. Other resolutions:
320 × 230 pixels |
640 × 459 pixels |
1,024 × 734 pixels |
1,280 × 918 pixels |
2,560 × 1,836 pixels |
884 × 634 pixels.
Original file (SVG file, nominally 884 × 634 pixels, file size: 2 KB)
| This is a file from the
Wikimedia Commons. Information from its
description page there is shown below. Commons is a freely licensed media file repository. You can help. |
Summary
| Description |
English: The graph highlights the concept of diminishing returns by plotting the curve of output against input. The areas of increasing, diminishing and negative returns are identified at points along the curve. There is also a point of maximum yield which is the point on the curve where producing another unit of output becomes inefficient and unproductive.
తెలుగు: తగ్గుతున్న రిటర్న్స్ గ్రాఫ్ఇన్పుట్కు వ్యతిరేకంగా అవుట్ పుట్ యొక్క వక్రతను గుర్తించడం ద్వారా రాబడిని తగ్గించే భావనను గ్రాఫ్ హైలైట్ చేస్తుంది.
فارسی: نمودار بازده نزولی که در آن سه ناحیهٔ بازده افزایشی، بیشینهٔ بازده، و کاهش بازده نشان داده شدهاند. |
| Date | 22 April 2021 (original upload date) |
| Source | Own work based on: Diminishing Returns Graph.png by Happyavocado |
| Author | Vectorization: Alhadis |
| SVG development |
|
|
This file supersedes the file
Diminishing Returns Graph.png. It is recommended to use this file rather than the other one.
|
|
Licensing
This file is licensed under the
Creative Commons
Attribution-Share Alike 4.0 International license.
Attribution: Happyavocado
- You are free:
- to share – to copy, distribute and transmit the work
- to remix – to adapt the work
- Under the following conditions:
- attribution – You must give appropriate credit, provide a link to the license, and indicate if changes were made. You may do so in any reasonable manner, but not in any way that suggests the licensor endorses you or your use.
- share alike – If you remix, transform, or build upon the material, you must distribute your contributions under the same or compatible license as the original.
File history
Click on a date/time to view the file as it appeared at that time.
| Date/Time | Thumbnail | Dimensions | User | Comment | |
|---|---|---|---|---|---|
| current | 18:55, 31 July 2022 |
| 884 × 634 (2 KB) | Alhadis | == {{int:filedesc}} == {{Information | Description = {{en|The graph highlights the concept of diminishing returns by plotting the curve of output against input. The areas of increasing, diminishing and negative returns are identified at points along the curve. There is also a point of maximum yield which is the point on the curve where producing another unit of output becomes inefficient and unproductive.}} | Source = {{Own based|Diminishing Returns Graph.png|by=Happyavocado}} | Date = {{Orig... |
File usage
The following pages on the English Wikipedia use this file (pages on other projects are not listed):
Global file usage
The following other wikis use this file:
- Usage on az.wikipedia.org
- Usage on fa.wikipedia.org
- Usage on is.wikipedia.org
- Usage on sv.wikipedia.org
- Usage on te.wikipedia.org