
Size of this PNG preview of this SVG file:
720 × 450 pixels. Other resolutions:
320 × 200 pixels |
640 × 400 pixels |
1,024 × 640 pixels |
1,280 × 800 pixels |
2,560 × 1,600 pixels.
Original file (SVG file, nominally 720 × 450 pixels, file size: 109 KB)
| This is a file from the
Wikimedia Commons. Information from its
description page there is shown below. Commons is a freely licensed media file repository. You can help. |
Summary
| Description |
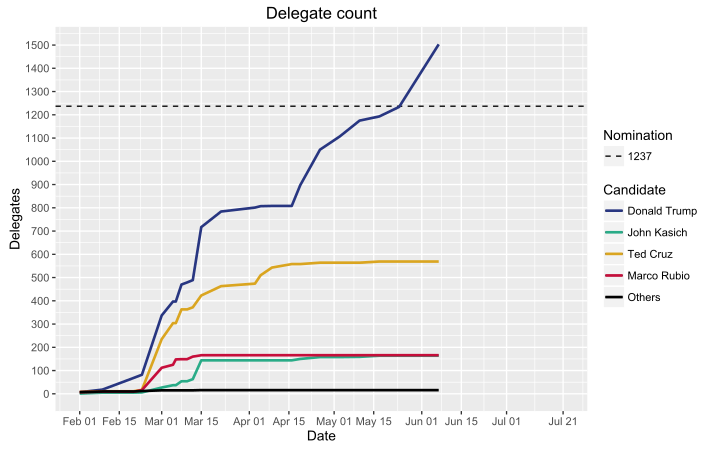
English: Delegate count for the 2016 Republican Party presidential primaries. Graph may not reflect the latest developments. Graph generated with an R script. |
| Date | |
| Source | Own work |
| Author | Abjiklam |
Licensing
I, the copyright holder of this work, hereby publish it under the following license:
This file is licensed under the
Creative Commons
Attribution-Share Alike 4.0 International license.
- You are free:
- to share – to copy, distribute and transmit the work
- to remix – to adapt the work
- Under the following conditions:
- attribution – You must give appropriate credit, provide a link to the license, and indicate if changes were made. You may do so in any reasonable manner, but not in any way that suggests the licensor endorses you or your use.
- share alike – If you remix, transform, or build upon the material, you must distribute your contributions under the same or compatible license as the original.
Code
The graph is generated by the following R script:
library(RCurl)
library(reshape)
library(htmltab)
library(ggplot2)
library(stringr)
library(scales) # needed if your code breaks at date_format function
Sys.setlocale("LC_TIME", "English") # results are in en_US format, you may need to specifically tell R to treat them that way

#get the table from the url
theurl <- getURL("/info/en/?search=Results_of_the_Republican_Party_presidential_primaries,_2016", ssl.verifyPeer=FALSE)
table <- htmltab(theurl, which=7)

#keep only the useful columns and name them
df <- table3:61, 1:ncol(table)-1
names(df)[1:2 <- c("Date", "State")

#extract delegate count
for (i in 3:ncol(df)) {
  df[[i]] = str_extract_all(df[[i]], "[0-9,]+ delegate")
  df[[i]] = as.numeric(str_extract(df[[i]], "[0-9,]+"))
}

#sum up minor candidates
df[[7]] = rowSums(df[,7:14], na.rm=TRUE)
names(df)[7 = "Others"
df = df[,1:7

#extract state names
df[[2]] = str_replace(df[[2]], "Binding[A-Za-z ]+", "")
df[[2]] = str_replace(df[[2]], "Territorial[A-Za-z ]+", "")
df[[2]] = str_replace(df[[2]], "State[A-Za-z ]+", "")
df[[2]] = str_replace(df[[2]], "District Co[A-Za-z ]+", "")
df[[2]] = str_replace(df[[2]], "District an[A-Za-z ]+", "")
df[[2]] = str_replace(df[[2]], "Conv[A-Za-z ]+", "")

#replace NA with 0
dfis.na(df)] = 0

#extract date or last day in date range
df$Date = sub("[0-9]+\\s*–\\s*([0-9]+)", "\\1", df$Date)
df$Date = sub("[0-9]+,\\s*([0-9]+)", "\\1", df$Date)
df$Date = as.Date(df$Date, format="%b %d")

#remove contests that haven't happened
df = dfrowSums(df[,3:7], na.rm=TRUE)!=0,]

#new dataframes for unique dates and cumulative count
df2 = data.frame(Date=unique(df$Date))
df3 = df2
for (i in 3:7) {
  df2[[names(df)[i]]] = rep(NA, length(df2$Date))
  df3[[names(df)[i]]] = rep(NA, length(df2$Date))
  for (j in 1:length(df2$Date)) {
    df2[[names(df)[i]]][j = sum(subset(df, Date==df2$Datej])[[names(df)[i]]])
    df3[[names(df)[i]]][j = sum(df2[[names(df)[i]]][1:j])
  }
}

#reshape data so that candidate becomes a variable
mdata <- melt(df2, id=c("Date"))
mdata2 <- melt(df3, id=c("Date"))
names(mdata) <- c("Date", "Candidate", "Delegates")
mdata[["Cumulative"]] <- mdata2[, 3

results = mdata

#nomination threshold
nomination <- data.frame(yintercept=1237, nomination=factor(1237))

#colors
colors <- c("#283681", "#29AB87", "#DAA520", "#C60E3B", "#000000")
labels = c("Trump", "Kasich", "Cruz", "Rubio", "Other")

#generate plot
d <- ggplot(results, aes(x=Date, y=Cumulative, group=Candidate, colour=Candidate)) +
  geom_hline(aes(yintercept=yintercept, linetype=nomination), data=nomination, show.legend=TRUE) +
  geom_path(size=1) +
  scale_color_manual(values=colors) +
  scale_y_continuous(breaks=seq(0, 2000, 100), minor_breaks=seq(0, 2000, 50)) +
  scale_x_date(limits=c(as.Date("2016/2/1"), as.Date("2016/7/21")),
               breaks=sort(c(seq(as.Date("2016/2/1"), as.Date("2016/7/21"), "month"),
                             seq(as.Date("2016/2/15"), as.Date("2016/7/14"), "month"),
                             as.Date("2016/7/21"))),
               labels=date_format("%b %d")) +
  scale_linetype_manual(values=c("dashed")) +
  labs(x="Date", y="Delegates", title="Delegate count", linetype="Nomination") +
  theme(plot.background = element_rect(fill="transparent",colour = NA)) +
  theme(legend.background = element_rect(fill="transparent",colour = NA))

#display plot
svg(filename="count.svg",
    width=8,
    height=5,
    pointsize=12,
    bg="transparent")
d
dev.off()
File history
Click on a date/time to view the file as it appeared at that time.
| Date/Time | Thumbnail | Dimensions | User | Comment | |
|---|---|---|---|---|---|
| current | 10:43, 8 June 2016 |
| 720 × 450 (109 KB) | Χ | update |
| 01:46, 27 May 2016 |
 | 720 × 450 (158 KB) | Byteflush | Updated (Washington primary) | |
| 15:17, 22 May 2016 |
 | 720 × 450 (156 KB) | Χ | minor | |
| 15:16, 22 May 2016 |
 | 720 × 450 (157 KB) | Χ | update | |
| 13:34, 6 April 2016 |
 | 484 × 333 (114 KB) | Χ | update | |
| 16:45, 4 April 2016 |
 | 484 × 333 (109 KB) | Χ | better | |
| 16:18, 4 April 2016 |
 | 484 × 333 (109 KB) | Χ | User created page with UploadWizard |
File usage
No pages on the English Wikipedia use this file (pages on other projects are not listed).
Global file usage
The following other wikis use this file:
- Usage on es.wikipedia.org
Metadata
Size of this PNG preview of this SVG file:
720 × 450 pixels. Other resolutions:
320 × 200 pixels |
640 × 400 pixels |
1,024 × 640 pixels |
1,280 × 800 pixels |
2,560 × 1,600 pixels.
Original file (SVG file, nominally 720 × 450 pixels, file size: 109 KB)
| This is a file from the
Wikimedia Commons. Information from its
description page there is shown below. Commons is a freely licensed media file repository. You can help. |
Summary
| Description |
English: Delegate count for the 2016 Republican Party presidential primaries. Graph may not reflect the latest developments. Graph generated with an R script. |
| Date | |
| Source | Own work |
| Author | Abjiklam |
Licensing
I, the copyright holder of this work, hereby publish it under the following license:
This file is licensed under the
Creative Commons
Attribution-Share Alike 4.0 International license.
- You are free:
- to share – to copy, distribute and transmit the work
- to remix – to adapt the work
- Under the following conditions:
- attribution – You must give appropriate credit, provide a link to the license, and indicate if changes were made. You may do so in any reasonable manner, but not in any way that suggests the licensor endorses you or your use.
- share alike – If you remix, transform, or build upon the material, you must distribute your contributions under the same or compatible license as the original.
Code
The graph is generated by the following R script:
library(RCurl)
library(reshape)
library(htmltab)
library(ggplot2)
library(stringr)
library(scales) # needed if your code breaks at date_format function
Sys.setlocale("LC_TIME", "English") # results are in en_US format, you may need to specifically tell R to treat them that way

#get the table from the url
theurl <- getURL("/info/en/?search=Results_of_the_Republican_Party_presidential_primaries,_2016", ssl.verifyPeer=FALSE)
table <- htmltab(theurl, which=7)

#keep only the useful columns and name them
df <- table3:61, 1:ncol(table)-1
names(df)[1:2 <- c("Date", "State")

#extract delegate count
for (i in 3:ncol(df)) {
  df[[i]] = str_extract_all(df[[i]], "[0-9,]+ delegate")
  df[[i]] = as.numeric(str_extract(df[[i]], "[0-9,]+"))
}

#sum up minor candidates
df[[7]] = rowSums(df[,7:14], na.rm=TRUE)
names(df)[7 = "Others"
df = df[,1:7

#extract state names
df[[2]] = str_replace(df[[2]], "Binding[A-Za-z ]+", "")
df[[2]] = str_replace(df[[2]], "Territorial[A-Za-z ]+", "")
df[[2]] = str_replace(df[[2]], "State[A-Za-z ]+", "")
df[[2]] = str_replace(df[[2]], "District Co[A-Za-z ]+", "")
df[[2]] = str_replace(df[[2]], "District an[A-Za-z ]+", "")
df[[2]] = str_replace(df[[2]], "Conv[A-Za-z ]+", "")

#replace NA with 0
dfis.na(df)] = 0

#extract date or last day in date range
df$Date = sub("[0-9]+\\s*–\\s*([0-9]+)", "\\1", df$Date)
df$Date = sub("[0-9]+,\\s*([0-9]+)", "\\1", df$Date)
df$Date = as.Date(df$Date, format="%b %d")

#remove contests that haven't happened
df = dfrowSums(df[,3:7], na.rm=TRUE)!=0,]

#new dataframes for unique dates and cumulative count
df2 = data.frame(Date=unique(df$Date))
df3 = df2
for (i in 3:7) {
  df2[[names(df)[i]]] = rep(NA, length(df2$Date))
  df3[[names(df)[i]]] = rep(NA, length(df2$Date))
  for (j in 1:length(df2$Date)) {
    df2[[names(df)[i]]][j = sum(subset(df, Date==df2$Datej])[[names(df)[i]]])
    df3[[names(df)[i]]][j = sum(df2[[names(df)[i]]][1:j])
  }
}

#reshape data so that candidate becomes a variable
mdata <- melt(df2, id=c("Date"))
mdata2 <- melt(df3, id=c("Date"))
names(mdata) <- c("Date", "Candidate", "Delegates")
mdata[["Cumulative"]] <- mdata2[, 3

results = mdata

#nomination threshold
nomination <- data.frame(yintercept=1237, nomination=factor(1237))

#colors
colors <- c("#283681", "#29AB87", "#DAA520", "#C60E3B", "#000000")
labels = c("Trump", "Kasich", "Cruz", "Rubio", "Other")

#generate plot
d <- ggplot(results, aes(x=Date, y=Cumulative, group=Candidate, colour=Candidate)) +
  geom_hline(aes(yintercept=yintercept, linetype=nomination), data=nomination, show.legend=TRUE) +
  geom_path(size=1) +
  scale_color_manual(values=colors) +
  scale_y_continuous(breaks=seq(0, 2000, 100), minor_breaks=seq(0, 2000, 50)) +
  scale_x_date(limits=c(as.Date("2016/2/1"), as.Date("2016/7/21")),
               breaks=sort(c(seq(as.Date("2016/2/1"), as.Date("2016/7/21"), "month"),
                             seq(as.Date("2016/2/15"), as.Date("2016/7/14"), "month"),
                             as.Date("2016/7/21"))),
               labels=date_format("%b %d")) +
  scale_linetype_manual(values=c("dashed")) +
  labs(x="Date", y="Delegates", title="Delegate count", linetype="Nomination") +
  theme(plot.background = element_rect(fill="transparent",colour = NA)) +
  theme(legend.background = element_rect(fill="transparent",colour = NA))

#display plot
svg(filename="count.svg",
    width=8,
    height=5,
    pointsize=12,
    bg="transparent")
d
dev.off()
File history
Click on a date/time to view the file as it appeared at that time.
| Date/Time | Thumbnail | Dimensions | User | Comment | |
|---|---|---|---|---|---|
| current | 10:43, 8 June 2016 |
| 720 × 450 (109 KB) | Χ | update |
| 01:46, 27 May 2016 |
| 720 × 450 (158 KB) | Byteflush | Updated (Washington primary) | |
| 15:17, 22 May 2016 |
| 720 × 450 (156 KB) | Χ | minor | |
| 15:16, 22 May 2016 |
| 720 × 450 (157 KB) | Χ | update | |
| 13:34, 6 April 2016 |
| 484 × 333 (114 KB) | Χ | update | |
| 16:45, 4 April 2016 |
| 484 × 333 (109 KB) | Χ | better | |
| 16:18, 4 April 2016 |
| 484 × 333 (109 KB) | Χ | User created page with UploadWizard |
File usage
No pages on the English Wikipedia use this file (pages on other projects are not listed).
Global file usage
The following other wikis use this file:
- Usage on es.wikipedia.org