
Size of this preview:
800 × 375 pixels. Other resolutions:
320 × 150 pixels |
640 × 300 pixels |
1,024 × 480 pixels |
1,280 × 600 pixels |
2,311 × 1,083 pixels.
Original file (2,311 × 1,083 pixels, file size: 1,014 KB, MIME type: image/png)
| This is a file from the
Wikimedia Commons. Information from its
description page there is shown below. Commons is a freely licensed media file repository. You can help. |
Summary
| Description |
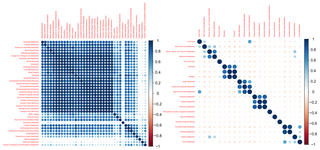
English: Plot of correlation matrix with clustering of double knockout distributions across sub-systems in E.coli and M.tuberculosis. |
| Date | |
| Source | I used the BFD_Processor function in my R package abcdeFBA to assemble files containing double knockout data generated by the Exhaustive_double_deletion function in abcdeFBA. |
| Author | Abhi asus 1987 |
Licensing
I, the copyright holder of this work, hereby publish it under the following license:
This file is licensed under the
Creative Commons
Attribution 3.0 Unported license.
- You are free:
- to share – to copy, distribute and transmit the work
- to remix – to adapt the work
- Under the following conditions:
- attribution – You must give appropriate credit, provide a link to the license, and indicate if changes were made. You may do so in any reasonable manner, but not in any way that suggests the licensor endorses you or your use.
File history
Click on a date/time to view the file as it appeared at that time.
| Date/Time | Thumbnail | Dimensions | User | Comment | |
|---|---|---|---|---|---|
| current | 18:53, 10 January 2013 |
| 2,311 × 1,083 (1,014 KB) | Abhi asus 1987 | Uploading a self-made file using File Upload Wizard |
File usage
The following pages on the English Wikipedia use this file (pages on other projects are not listed):
Metadata
Size of this preview:
800 × 375 pixels. Other resolutions:
320 × 150 pixels |
640 × 300 pixels |
1,024 × 480 pixels |
1,280 × 600 pixels |
2,311 × 1,083 pixels.
Original file (2,311 × 1,083 pixels, file size: 1,014 KB, MIME type: image/png)
| This is a file from the
Wikimedia Commons. Information from its
description page there is shown below. Commons is a freely licensed media file repository. You can help. |
Summary
| Description |
English: Plot of correlation matrix with clustering of double knockout distributions across sub-systems in E.coli and M.tuberculosis. |
| Date | |
| Source | I used the BFD_Processor function in my R package abcdeFBA to assemble files containing double knockout data generated by the Exhaustive_double_deletion function in abcdeFBA. |
| Author | Abhi asus 1987 |
Licensing
I, the copyright holder of this work, hereby publish it under the following license:
This file is licensed under the
Creative Commons
Attribution 3.0 Unported license.
- You are free:
- to share – to copy, distribute and transmit the work
- to remix – to adapt the work
- Under the following conditions:
- attribution – You must give appropriate credit, provide a link to the license, and indicate if changes were made. You may do so in any reasonable manner, but not in any way that suggests the licensor endorses you or your use.
File history
Click on a date/time to view the file as it appeared at that time.
| Date/Time | Thumbnail | Dimensions | User | Comment | |
|---|---|---|---|---|---|
| current | 18:53, 10 January 2013 |
| 2,311 × 1,083 (1,014 KB) | Abhi asus 1987 | Uploading a self-made file using File Upload Wizard |
File usage
The following pages on the English Wikipedia use this file (pages on other projects are not listed):