
Size of this PNG preview of this SVG file:
540 × 450 pixels. Other resolutions:
288 × 240 pixels |
576 × 480 pixels |
922 × 768 pixels |
1,229 × 1,024 pixels |
2,458 × 2,048 pixels.
Original file (SVG file, nominally 540 × 450 pixels, file size: 75 KB)
| This is a file from the
Wikimedia Commons. Information from its
description page there is shown below. Commons is a freely licensed media file repository. You can help. |
Summary
| Description |
English: A
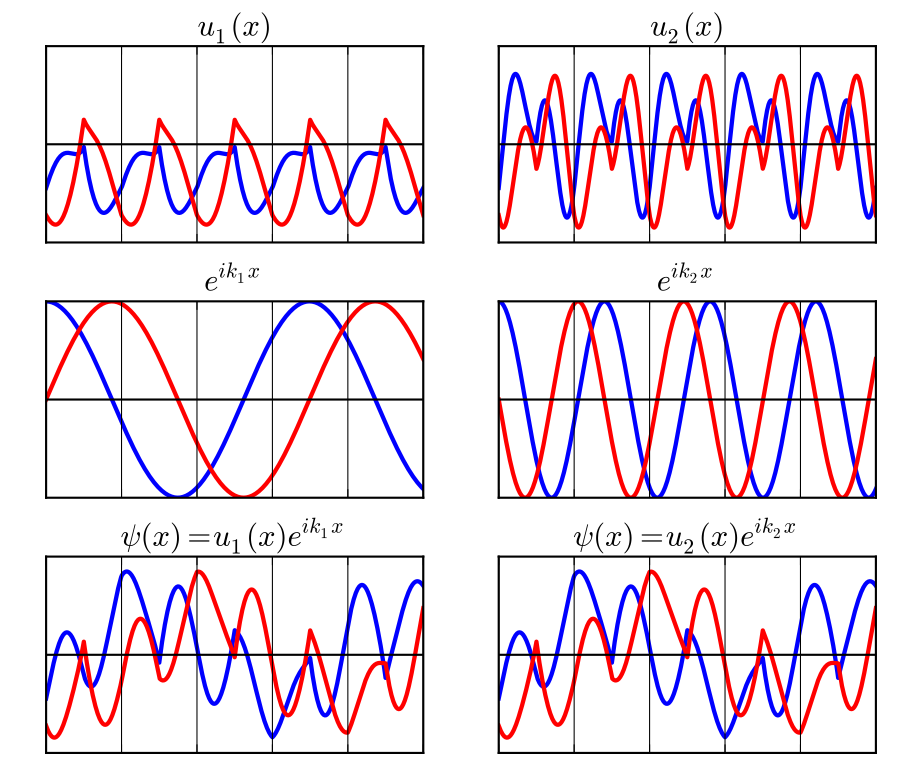
Bloch wave (bottom) can be broken up into the product of a periodic function (top) and a plane-wave (center). Blue is real part, red is imaginary part. The left side and right side represent the same Bloch wave broken up in two different ways, involving the wave vector k1 (left) or k2 (right). The difference (k1-k2) is a reciprocal lattice vector.
Español: Una onda de Bloch (abajo) puede expresarse como el producto de una función periódica (arriba) y una onda plana (medio). La parte real es azul, y la parte imaginaria en rojo. Los lados izquierdo y derecho representan la misma onda de Bloch expresada de dos formas diferentes, involucrando los vectores de onda k1 (izquierda) o k2 (derecha). La diferencia (k1-k2) es un vector de la red recíproca. |
| Date | |
| Source | Own work |
| Author | Sbyrnes321 |
| SVG development | This plot was created with
Matplotlib. |
| Source code | Python code"""
Steven Byrnes, 2013. This code is released to the public domain.
Written using Python 2.7, Matplotlib 1.2.1
"""
from __future__ import division
import math
from math import pi
import matplotlib.pyplot as plt
import numpy as np
def u1(x):
"""a funny looking function with period 1"""
fpart = math.modf(x)[0
d = abs(fpart - 0.5)
return ((1j * math.cos(2 * pi * x + 2) + 1 / (d + 0.3) - 3)) * (1+1j)
x_list = np.linspace(0,5,num=5000)
k1 = 1.8
k2 = k1 - 2 * pi
u1_list = np.array([u1(x) for x in x_list])
u1_re_list = u1_list.real
u1_im_list = u1_list.imag
u2_list = u1_list * np.exp(2 * pi * 1j * x_list)
u2_re_list = u2_list.real
u2_im_list = u2_list.imag
exp1_list = np.exp(1j * k1 * x_list)
exp1_re_list = exp1_list.real
exp1_im_list = exp1_list.imag
exp2_list = np.exp(1j * k2 * x_list)
exp2_re_list = exp2_list.real
exp2_im_list = exp2_list.imag
psi1_list = u1_list * exp1_list
psi1_re_list = psi1_list.real
psi1_im_list = psi1_list.imag
psi2_list = u2_list * exp2_list
psi2_re_list = psi2_list.real
psi2_im_list = psi2_list.imag
assert max(abs(psi1_list - psi2_list)) < 1e-10
fig, ((ax1, ax2), (ax3, ax4), (ax5, ax6)) = plt.subplots(3, 2, sharex=True,
figsize=(6,5))
ax1.set_title('$u_1(x)$')
ax1.plot(x_list, u1_re_list, 'b', x_list, u1_im_list, 'r', linewidth=2)
ax2.set_title('$u_2(x)$')
ax2.plot(x_list, u2_re_list, 'b', x_list, u2_im_list, 'r', linewidth=2)
ax3.set_title('$e^{i k_1 x}$')
ax3.plot(x_list, exp1_re_list, 'b', x_list, exp1_im_list, 'r', linewidth=2)
ax4.set_title('$e^{i k_2 x}$')
ax4.plot(x_list, exp2_re_list, 'b', x_list, exp2_im_list, 'r', linewidth=2)
ax5.set_title('$\psi(x) = u_1(x) e^{i k_1 x}$')
ax5.plot(x_list, psi1_re_list, 'b', x_list, psi1_im_list, 'r', linewidth=2)
ax6.set_title('$\psi(x) = u_2(x) e^{i k_2 x}$')
ax6.plot(x_list, psi2_re_list, 'b', x_list, psi2_im_list, 'r', linewidth=2)
for ax in ax1, ax2, ax3, ax4, ax5, ax6]:
ax.xaxis.grid(which='major', linestyle='-')
ax.xaxis.set_ticklabels([])
ax.yaxis.set_visible(False)
ax.axhline(y=0, color='k')
for ax in ax1, ax2]:
ax.set_ylim(-3, 3)
fig.subplots_adjust(left=0.05, right=0.95, bottom=0.02, top=0.94, hspace=0.3)
fig.savefig('/home/steve/Desktop/out.svg')
|
Licensing
I, the copyright holder of this work, hereby publish it under the following license:
| This file is made available under the Creative Commons CC0 1.0 Universal Public Domain Dedication. | |
| The person who associated a work with this deed has dedicated the work to the
public domain by waiving all of their rights to the work worldwide under copyright law, including all related and neighboring rights, to the extent allowed by law. You can copy, modify, distribute and perform the work, even for commercial purposes, all without asking permission.
|
File history
Click on a date/time to view the file as it appeared at that time.
| Date/Time | Thumbnail | Dimensions | User | Comment | |
|---|---|---|---|---|---|
| current | 01:54, 23 September 2013 |
| 540 × 450 (75 KB) | Sbyrnes321 | User created page with UploadWizard |
File usage
The following pages on the English Wikipedia use this file (pages on other projects are not listed):
Metadata
Size of this PNG preview of this SVG file:
540 × 450 pixels. Other resolutions:
288 × 240 pixels |
576 × 480 pixels |
922 × 768 pixels |
1,229 × 1,024 pixels |
2,458 × 2,048 pixels.
Original file (SVG file, nominally 540 × 450 pixels, file size: 75 KB)
| This is a file from the
Wikimedia Commons. Information from its
description page there is shown below. Commons is a freely licensed media file repository. You can help. |
Summary
| Description |
English: A
Bloch wave (bottom) can be broken up into the product of a periodic function (top) and a plane-wave (center). Blue is real part, red is imaginary part. The left side and right side represent the same Bloch wave broken up in two different ways, involving the wave vector k1 (left) or k2 (right). The difference (k1-k2) is a reciprocal lattice vector.
Español: Una onda de Bloch (abajo) puede expresarse como el producto de una función periódica (arriba) y una onda plana (medio). La parte real es azul, y la parte imaginaria en rojo. Los lados izquierdo y derecho representan la misma onda de Bloch expresada de dos formas diferentes, involucrando los vectores de onda k1 (izquierda) o k2 (derecha). La diferencia (k1-k2) es un vector de la red recíproca. |
| Date | |
| Source | Own work |
| Author | Sbyrnes321 |
| SVG development | This plot was created with
Matplotlib. |
| Source code | Python code"""
Steven Byrnes, 2013. This code is released to the public domain.
Written using Python 2.7, Matplotlib 1.2.1
"""
from __future__ import division
import math
from math import pi
import matplotlib.pyplot as plt
import numpy as np
def u1(x):
"""a funny looking function with period 1"""
fpart = math.modf(x)[0
d = abs(fpart - 0.5)
return ((1j * math.cos(2 * pi * x + 2) + 1 / (d + 0.3) - 3)) * (1+1j)
x_list = np.linspace(0,5,num=5000)
k1 = 1.8
k2 = k1 - 2 * pi
u1_list = np.array([u1(x) for x in x_list])
u1_re_list = u1_list.real
u1_im_list = u1_list.imag
u2_list = u1_list * np.exp(2 * pi * 1j * x_list)
u2_re_list = u2_list.real
u2_im_list = u2_list.imag
exp1_list = np.exp(1j * k1 * x_list)
exp1_re_list = exp1_list.real
exp1_im_list = exp1_list.imag
exp2_list = np.exp(1j * k2 * x_list)
exp2_re_list = exp2_list.real
exp2_im_list = exp2_list.imag
psi1_list = u1_list * exp1_list
psi1_re_list = psi1_list.real
psi1_im_list = psi1_list.imag
psi2_list = u2_list * exp2_list
psi2_re_list = psi2_list.real
psi2_im_list = psi2_list.imag
assert max(abs(psi1_list - psi2_list)) < 1e-10
fig, ((ax1, ax2), (ax3, ax4), (ax5, ax6)) = plt.subplots(3, 2, sharex=True,
figsize=(6,5))
ax1.set_title('$u_1(x)$')
ax1.plot(x_list, u1_re_list, 'b', x_list, u1_im_list, 'r', linewidth=2)
ax2.set_title('$u_2(x)$')
ax2.plot(x_list, u2_re_list, 'b', x_list, u2_im_list, 'r', linewidth=2)
ax3.set_title('$e^{i k_1 x}$')
ax3.plot(x_list, exp1_re_list, 'b', x_list, exp1_im_list, 'r', linewidth=2)
ax4.set_title('$e^{i k_2 x}$')
ax4.plot(x_list, exp2_re_list, 'b', x_list, exp2_im_list, 'r', linewidth=2)
ax5.set_title('$\psi(x) = u_1(x) e^{i k_1 x}$')
ax5.plot(x_list, psi1_re_list, 'b', x_list, psi1_im_list, 'r', linewidth=2)
ax6.set_title('$\psi(x) = u_2(x) e^{i k_2 x}$')
ax6.plot(x_list, psi2_re_list, 'b', x_list, psi2_im_list, 'r', linewidth=2)
for ax in ax1, ax2, ax3, ax4, ax5, ax6]:
ax.xaxis.grid(which='major', linestyle='-')
ax.xaxis.set_ticklabels([])
ax.yaxis.set_visible(False)
ax.axhline(y=0, color='k')
for ax in ax1, ax2]:
ax.set_ylim(-3, 3)
fig.subplots_adjust(left=0.05, right=0.95, bottom=0.02, top=0.94, hspace=0.3)
fig.savefig('/home/steve/Desktop/out.svg')
|
Licensing
I, the copyright holder of this work, hereby publish it under the following license:
| This file is made available under the Creative Commons CC0 1.0 Universal Public Domain Dedication. | |
| The person who associated a work with this deed has dedicated the work to the
public domain by waiving all of their rights to the work worldwide under copyright law, including all related and neighboring rights, to the extent allowed by law. You can copy, modify, distribute and perform the work, even for commercial purposes, all without asking permission.
|
File history
Click on a date/time to view the file as it appeared at that time.
| Date/Time | Thumbnail | Dimensions | User | Comment | |
|---|---|---|---|---|---|
| current | 01:54, 23 September 2013 |
| 540 × 450 (75 KB) | Sbyrnes321 | User created page with UploadWizard |
File usage
The following pages on the English Wikipedia use this file (pages on other projects are not listed):