
Original file (SVG file, nominally 480 × 280 pixels, file size: 8 KB)
| This is a file from the
Wikimedia Commons. Information from its
description page there is shown below. Commons is a freely licensed media file repository. You can help. |

Summary
| Description |
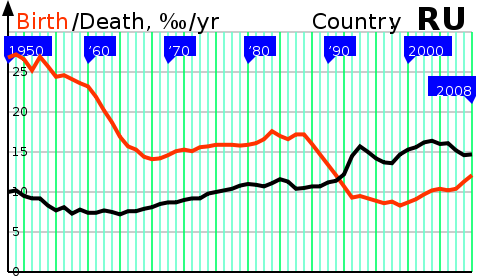
Русский: Рождаемость и смертность в РСФСР и Российской Федерации 1950 – 2008 (
Демографический кризис в Российской Федерации). |
| Date | |
| Source | Own work |
| Author | Incnis Mrsi |
| Other versions | BirthDeath 1979 RU.svg, RNI 1950 RU.svg, Russian Cross.jpg, Natural Population Growth of Russia.PNG |
| SVG development | This
chart was created with an unknown SVG tool. |
Disclaimer: The author of this graph gives no warranty and accepts no responsibility for its factual accuracy. This graph is nothing but a visualization of data from [1] [2], which may be incomplete or error-prone.
If you find an error, please, correct the data in a <path d="…"/> tag (adding some comments about your reliable source) and upload the file over.
Licensing
| I, the copyright holder of this work, release this work into the
public domain. This applies worldwide. In some countries this may not be legally possible; if so: I grant anyone the right to use this work for any purpose, without any conditions, unless such conditions are required by law. |
File history
Click on a date/time to view the file as it appeared at that time.
| Date/Time | Thumbnail | Dimensions | User | Comment | |
|---|---|---|---|---|---|
| current | 07:09, 13 July 2009 |
| 480 × 280 (8 KB) | Incnis Mrsi | {{Information |Description={{en|1=The birth and death rates in Russia 1950–2008 ( w:Russian Cross).}} {{ru|1=Рождаемость и смертность в РСФСР и Россиийской Федерации 1950 – 2008 ([[ru:Русск� |
File usage
Global file usage
The following other wikis use this file:
- Usage on ast.wikipedia.org
- Usage on cs.wikipedia.org
- Usage on es.wikipedia.org
- Usage on id.wikipedia.org
- Usage on lt.wikipedia.org
- Usage on pt.wikipedia.org
Original file (SVG file, nominally 480 × 280 pixels, file size: 8 KB)
| This is a file from the
Wikimedia Commons. Information from its
description page there is shown below. Commons is a freely licensed media file repository. You can help. |
Summary
| Description |
Русский: Рождаемость и смертность в РСФСР и Российской Федерации 1950 – 2008 (
Демографический кризис в Российской Федерации). |
| Date | |
| Source | Own work |
| Author | Incnis Mrsi |
| Other versions | BirthDeath 1979 RU.svg, RNI 1950 RU.svg, Russian Cross.jpg, Natural Population Growth of Russia.PNG |
| SVG development | This
chart was created with an unknown SVG tool. |
Disclaimer: The author of this graph gives no warranty and accepts no responsibility for its factual accuracy. This graph is nothing but a visualization of data from [1] [2], which may be incomplete or error-prone.
If you find an error, please, correct the data in a <path d="…"/> tag (adding some comments about your reliable source) and upload the file over.
Licensing
| I, the copyright holder of this work, release this work into the
public domain. This applies worldwide. In some countries this may not be legally possible; if so: I grant anyone the right to use this work for any purpose, without any conditions, unless such conditions are required by law. |
File history
Click on a date/time to view the file as it appeared at that time.
| Date/Time | Thumbnail | Dimensions | User | Comment | |
|---|---|---|---|---|---|
| current | 07:09, 13 July 2009 |
| 480 × 280 (8 KB) | Incnis Mrsi | {{Information |Description={{en|1=The birth and death rates in Russia 1950–2008 ( w:Russian Cross).}} {{ru|1=Рождаемость и смертность в РСФСР и Россиийской Федерации 1950 – 2008 ([[ru:Русск� |
File usage
Global file usage
The following other wikis use this file:
- Usage on ast.wikipedia.org
- Usage on cs.wikipedia.org
- Usage on es.wikipedia.org
- Usage on id.wikipedia.org
- Usage on lt.wikipedia.org
- Usage on pt.wikipedia.org