
Size of this PNG preview of this SVG file:
375 × 600 pixels. Other resolutions:
150 × 240 pixels |
300 × 480 pixels |
480 × 768 pixels |
640 × 1,024 pixels |
1,280 × 2,048 pixels |
450 × 720 pixels.
Original file (SVG file, nominally 450 × 720 pixels, file size: 32 KB)
| This is a file from the
Wikimedia Commons. Information from its
description page there is shown below. Commons is a freely licensed media file repository. You can help. |
Summary
| Description |
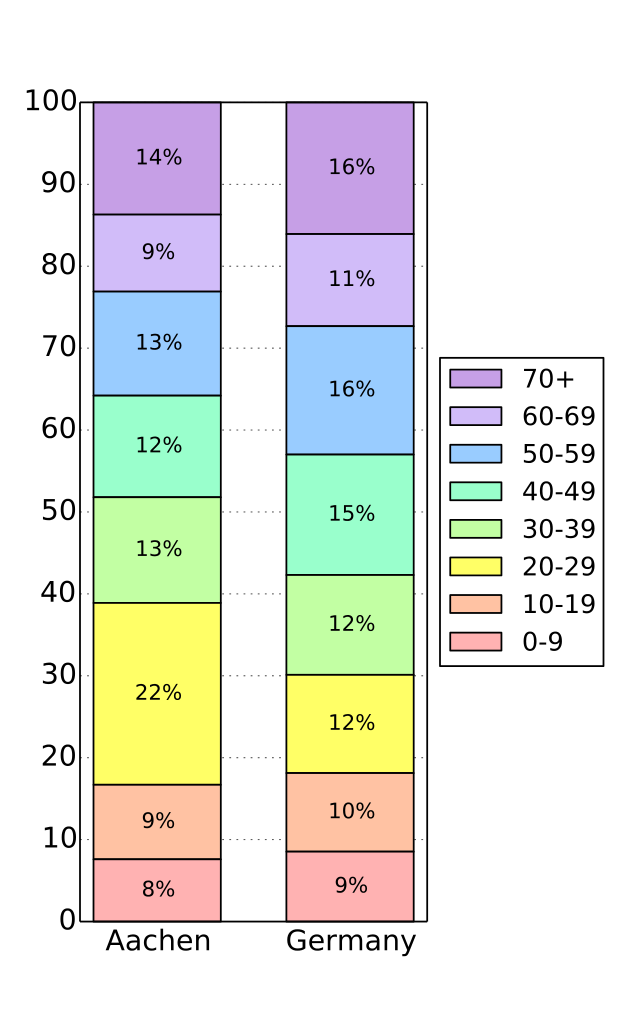
English: The age structure of Aachen compared to that of Germany, in groups of ten years. (2014)
Source for Aachen: http://www.aachen.de/de/tourismus_stadtinfo/pdf/statistik/zahlendatenfakten.pdf Source for Germany: http://de.statista.com/statistik/daten/studie/1351/umfrage/altersstruktur-der-bevoelkerung-deutschlands/ Created using Python, numpy and matplotlib. |
||
| Date | |||
| Source | Own work | ||
| Author | Xjcl | ||
| SVG development | This plot was created with
Matplotlib. | ||
| Source code | Python code
|
Licensing
I, the copyright holder of this work, hereby publish it under the following license:
This file is licensed under the
Creative Commons
Attribution-Share Alike 4.0 International license.
- You are free:
- to share – to copy, distribute and transmit the work
- to remix – to adapt the work
- Under the following conditions:
- attribution – You must give appropriate credit, provide a link to the license, and indicate if changes were made. You may do so in any reasonable manner, but not in any way that suggests the licensor endorses you or your use.
- share alike – If you remix, transform, or build upon the material, you must distribute your contributions under the same or compatible license as the original.
File history
Click on a date/time to view the file as it appeared at that time.
| Date/Time | Thumbnail | Dimensions | User | Comment | |
|---|---|---|---|---|---|
| current | 13:41, 23 April 2016 |
| 450 × 720 (32 KB) | Xjcl | Changed aspect ratio |
| 12:40, 23 April 2016 |
 | 720 × 540 (32 KB) | Xjcl | User created page with UploadWizard |
File usage
The following pages on the English Wikipedia use this file (pages on other projects are not listed):
Metadata
Size of this PNG preview of this SVG file:
375 × 600 pixels. Other resolutions:
150 × 240 pixels |
300 × 480 pixels |
480 × 768 pixels |
640 × 1,024 pixels |
1,280 × 2,048 pixels |
450 × 720 pixels.
Original file (SVG file, nominally 450 × 720 pixels, file size: 32 KB)
| This is a file from the
Wikimedia Commons. Information from its
description page there is shown below. Commons is a freely licensed media file repository. You can help. |
Summary
| Description |
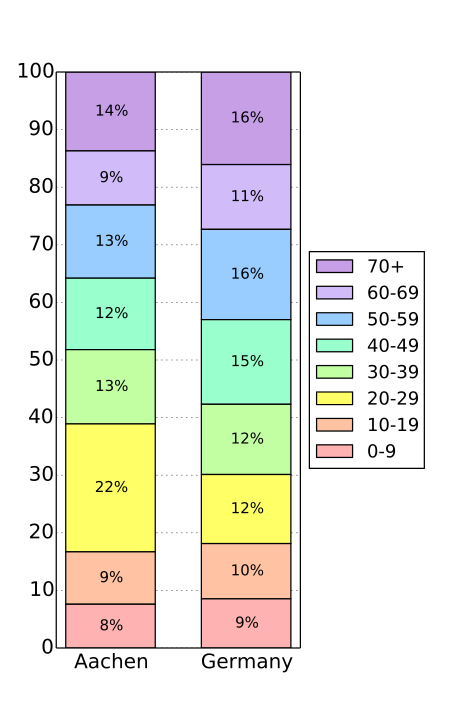
English: The age structure of Aachen compared to that of Germany, in groups of ten years. (2014)
Source for Aachen: http://www.aachen.de/de/tourismus_stadtinfo/pdf/statistik/zahlendatenfakten.pdf Source for Germany: http://de.statista.com/statistik/daten/studie/1351/umfrage/altersstruktur-der-bevoelkerung-deutschlands/ Created using Python, numpy and matplotlib. |
||
| Date | |||
| Source | Own work | ||
| Author | Xjcl | ||
| SVG development | This plot was created with
Matplotlib. | ||
| Source code | Python code
|
Licensing
I, the copyright holder of this work, hereby publish it under the following license:
This file is licensed under the
Creative Commons
Attribution-Share Alike 4.0 International license.
- You are free:
- to share – to copy, distribute and transmit the work
- to remix – to adapt the work
- Under the following conditions:
- attribution – You must give appropriate credit, provide a link to the license, and indicate if changes were made. You may do so in any reasonable manner, but not in any way that suggests the licensor endorses you or your use.
- share alike – If you remix, transform, or build upon the material, you must distribute your contributions under the same or compatible license as the original.
File history
Click on a date/time to view the file as it appeared at that time.
| Date/Time | Thumbnail | Dimensions | User | Comment | |
|---|---|---|---|---|---|
| current | 13:41, 23 April 2016 |
| 450 × 720 (32 KB) | Xjcl | Changed aspect ratio |
| 12:40, 23 April 2016 |
| 720 × 540 (32 KB) | Xjcl | User created page with UploadWizard |
File usage
The following pages on the English Wikipedia use this file (pages on other projects are not listed):