Size of this preview:
785 × 600 pixels. Other resolutions:
314 × 240 pixels |
628 × 480 pixels |
1,005 × 768 pixels |
1,280 × 978 pixels |
2,118 × 1,618 pixels.
Original file (2,118 × 1,618 pixels, file size: 256 KB, MIME type: image/png)
| This is a file from the
Wikimedia Commons. Information from its
description page there is shown below. Commons is a freely licensed media file repository. You can help. |
Summary
| Description |
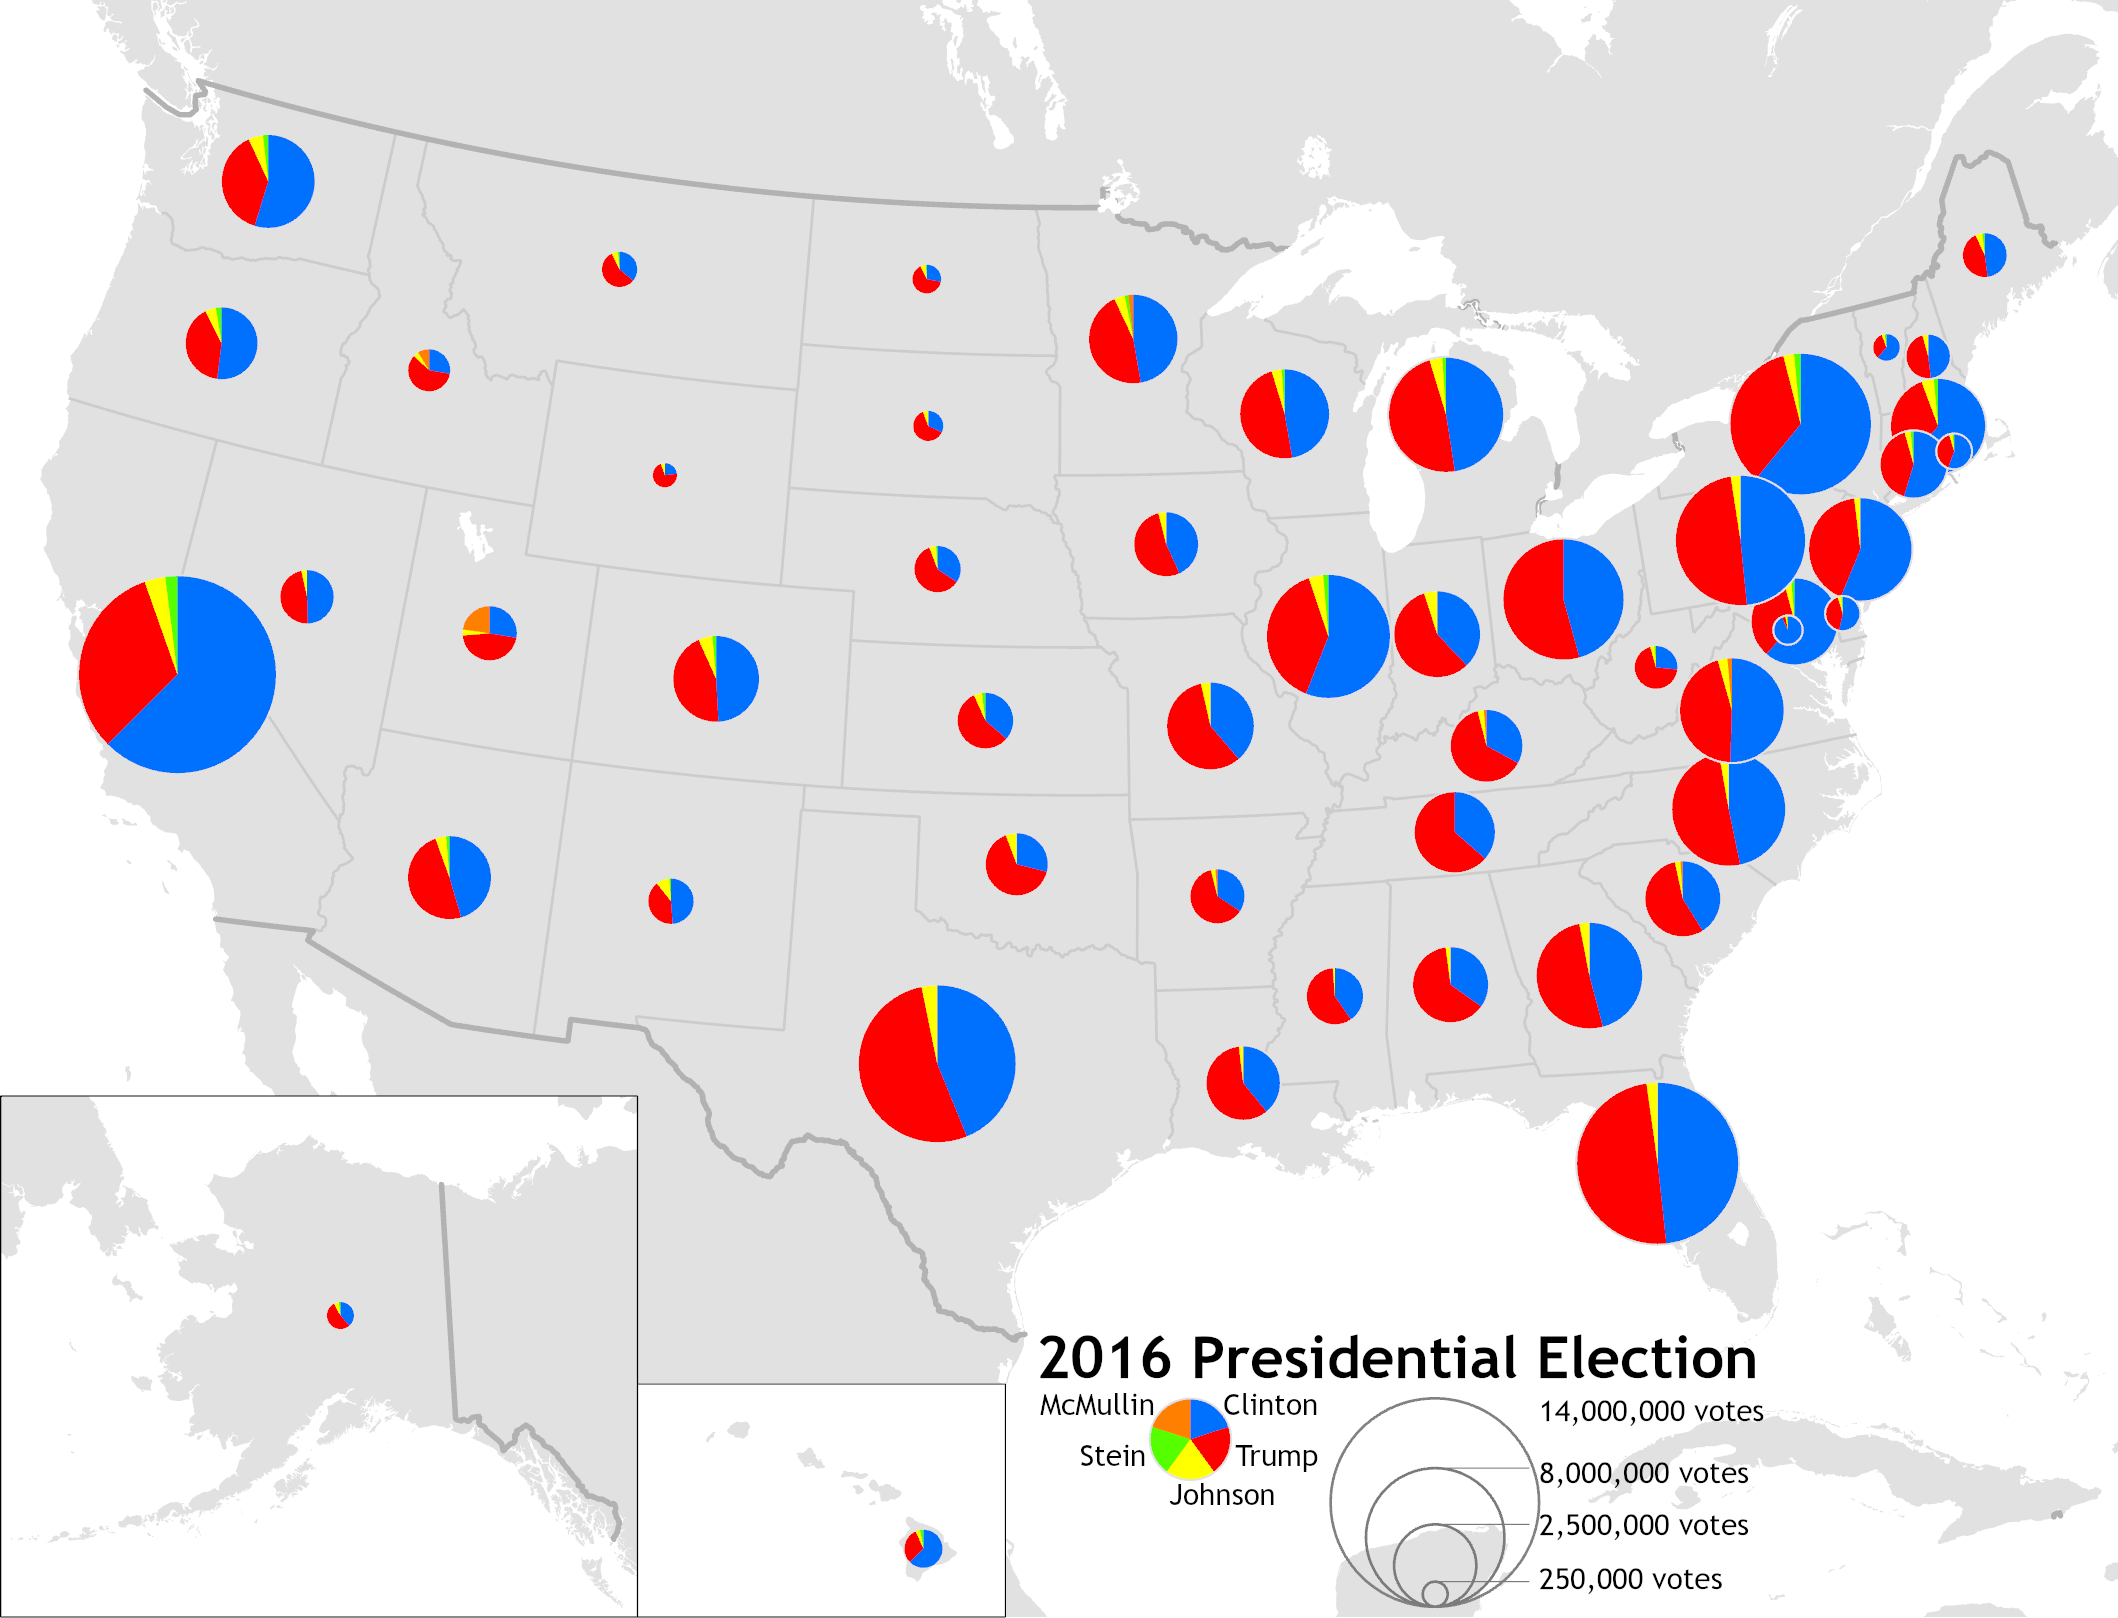
English: Map of the 2016 U.S. presidential election, showing the relative vote totals as pie charts proportional to the state vote total. |
| Date | |
| Source | raw data from MIT Election Data and Science Lab, 2017, "U.S. President 1976–2016", https://doi.org/10.7910/DVN/42MVDX |
| Author | Bplewe |
Licensing
I, the copyright holder of this work, hereby publish it under the following licenses:

|
Permission is granted to copy, distribute and/or modify this document under the terms of the GNU Free Documentation License, Version 1.2 or any later version published by the Free Software Foundation; with no Invariant Sections, no Front-Cover Texts, and no Back-Cover Texts. A copy of the license is included in the section entitled GNU Free Documentation License. |
This file is licensed under the
Creative Commons
Attribution-Share Alike 4.0 International license.
- You are free:
- to share – to copy, distribute and transmit the work
- to remix – to adapt the work
- Under the following conditions:
- attribution – You must give appropriate credit, provide a link to the license, and indicate if changes were made. You may do so in any reasonable manner, but not in any way that suggests the licensor endorses you or your use.
- share alike – If you remix, transform, or build upon the material, you must distribute your contributions under the same or compatible license as the original.
You may select the license of your choice.
File history
Click on a date/time to view the file as it appeared at that time.
| Date/Time | Thumbnail | Dimensions | User | Comment | |
|---|---|---|---|---|---|
| current | 07:19, 3 November 2020 |
| 2,118 × 1,618 (256 KB) | Bplewe | Added McMullin vote |
| 06:53, 3 November 2020 |
 | 2,118 × 1,618 (251 KB) | Bplewe | {{subst:Upload marker added by en.wp UW}} {{Information |Description = {{en|Map of the 2016 U.S. presidential election, showing the relative vote totals as pie charts proportional to the state vote total.}} |Source = raw data from MIT Election Data and Science Lab, 2017, "U.S. President 1976–2016", https://doi.org/10.7910/DVN/42MVDX |Date = 2020-11-02 |Author = Bplewe }} |
File usage
The following pages on the English Wikipedia use this file (pages on other projects are not listed):
Global file usage
The following other wikis use this file:
- Usage on www.wikidata.org
Metadata
Size of this preview:
785 × 600 pixels. Other resolutions:
314 × 240 pixels |
628 × 480 pixels |
1,005 × 768 pixels |
1,280 × 978 pixels |
2,118 × 1,618 pixels.
Original file (2,118 × 1,618 pixels, file size: 256 KB, MIME type: image/png)
| This is a file from the
Wikimedia Commons. Information from its
description page there is shown below. Commons is a freely licensed media file repository. You can help. |
Summary
| Description |
English: Map of the 2016 U.S. presidential election, showing the relative vote totals as pie charts proportional to the state vote total. |
| Date | |
| Source | raw data from MIT Election Data and Science Lab, 2017, "U.S. President 1976–2016", https://doi.org/10.7910/DVN/42MVDX |
| Author | Bplewe |
Licensing
I, the copyright holder of this work, hereby publish it under the following licenses:
|
|
Permission is granted to copy, distribute and/or modify this document under the terms of the GNU Free Documentation License, Version 1.2 or any later version published by the Free Software Foundation; with no Invariant Sections, no Front-Cover Texts, and no Back-Cover Texts. A copy of the license is included in the section entitled GNU Free Documentation License. |
This file is licensed under the
Creative Commons
Attribution-Share Alike 4.0 International license.
- You are free:
- to share – to copy, distribute and transmit the work
- to remix – to adapt the work
- Under the following conditions:
- attribution – You must give appropriate credit, provide a link to the license, and indicate if changes were made. You may do so in any reasonable manner, but not in any way that suggests the licensor endorses you or your use.
- share alike – If you remix, transform, or build upon the material, you must distribute your contributions under the same or compatible license as the original.
You may select the license of your choice.
File history
Click on a date/time to view the file as it appeared at that time.
| Date/Time | Thumbnail | Dimensions | User | Comment | |
|---|---|---|---|---|---|
| current | 07:19, 3 November 2020 |
| 2,118 × 1,618 (256 KB) | Bplewe | Added McMullin vote |
| 06:53, 3 November 2020 |
| 2,118 × 1,618 (251 KB) | Bplewe | {{subst:Upload marker added by en.wp UW}} {{Information |Description = {{en|Map of the 2016 U.S. presidential election, showing the relative vote totals as pie charts proportional to the state vote total.}} |Source = raw data from MIT Election Data and Science Lab, 2017, "U.S. President 1976–2016", https://doi.org/10.7910/DVN/42MVDX |Date = 2020-11-02 |Author = Bplewe }} |
File usage
The following pages on the English Wikipedia use this file (pages on other projects are not listed):
Global file usage
The following other wikis use this file:
- Usage on www.wikidata.org