Size of this preview:
525 × 599 pixels. Other resolutions:
210 × 240 pixels |
420 × 480 pixels |
673 × 768 pixels |
1,131 × 1,291 pixels.
Original file (1,131 × 1,291 pixels, file size: 32 KB, MIME type: image/png)
| This is a file from the
Wikimedia Commons. Information from its
description page there is shown below. Commons is a freely licensed media file repository. You can help. |
Summary
| Description |
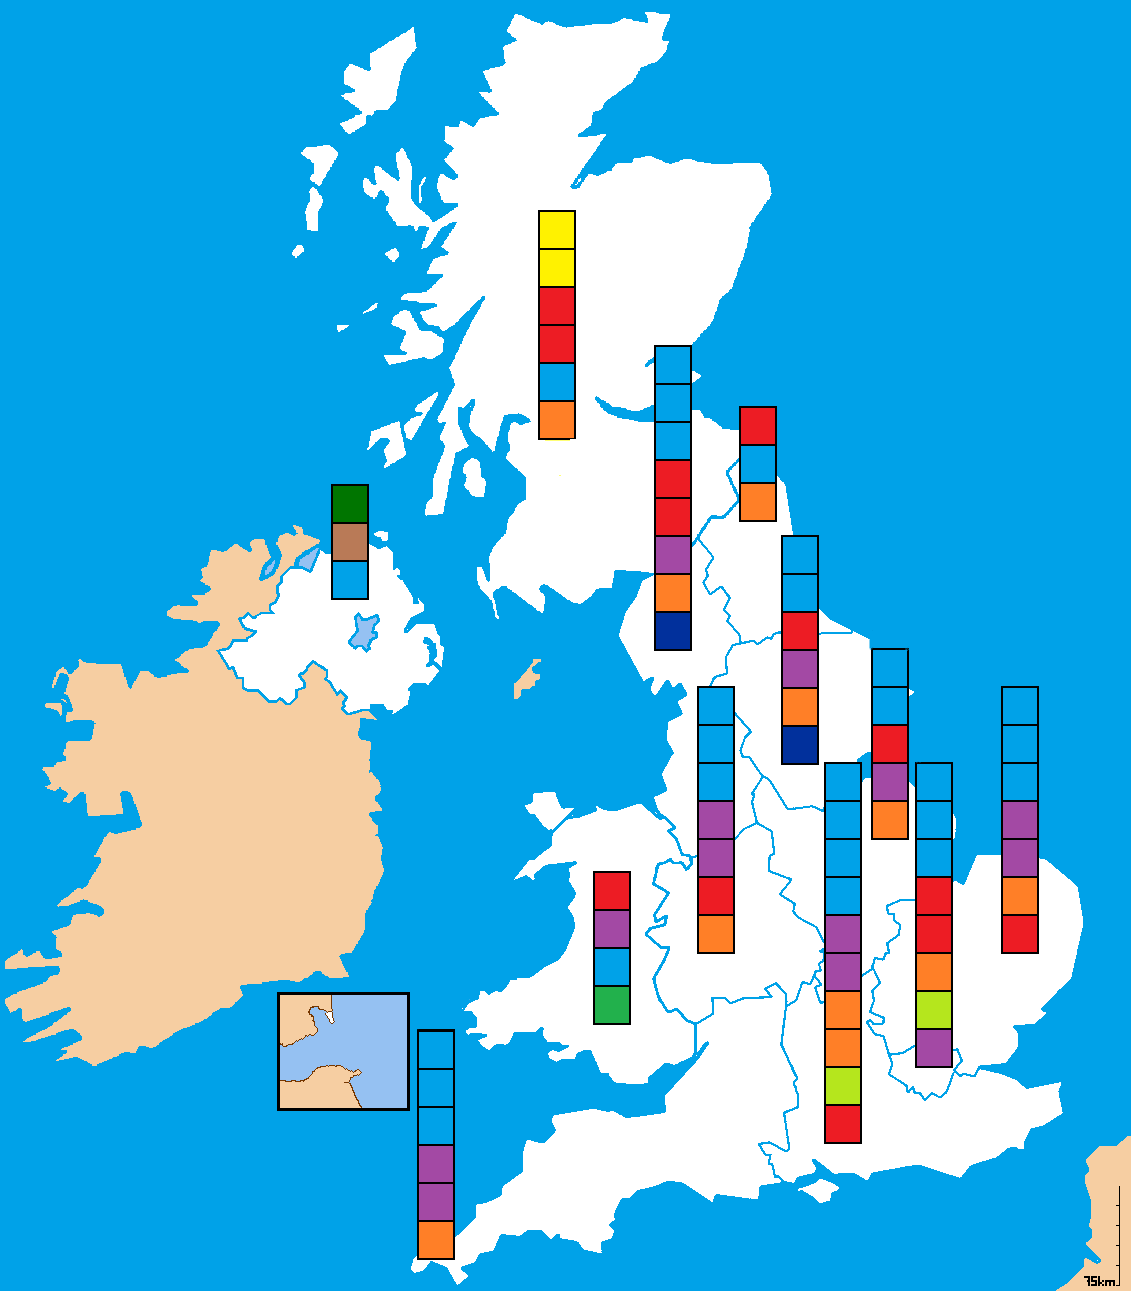
English: A map of British constituencies used for the 2009 European Parliament Election. Colours indicate winning party. |
| Date | |
| Source | Own work |
| Author | Mwhite148 |
Licensing
| I, the copyright holder of this work, release this work into the
public domain. This applies worldwide. In some countries this may not be legally possible; if so: I grant anyone the right to use this work for any purpose, without any conditions, unless such conditions are required by law. |
File history
Click on a date/time to view the file as it appeared at that time.
| Date/Time | Thumbnail | Dimensions | User | Comment | |
|---|---|---|---|---|---|
| current | 12:20, 21 June 2015 |
| 1,131 × 1,291 (32 KB) | DrKay | removing brown line on part of Scottish coast |
| 15:33, 10 April 2015 |
 | 1,131 × 1,291 (32 KB) | DrKay | parties ranked top to bottom in order of vote share per region | |
| 12:08, 28 May 2011 |
 | 1,131 × 1,291 (64 KB) | Bastin | Correct NW England (Lib Dem was denominated yellow, which is SNP - not sure they have an MEP south of the border!). | |
| 15:02, 23 October 2010 |
 | 1,131 × 1,291 (55 KB) | Mwhite148 | {{Information |Description={{en|1=A map of British constituencies used for the 2009 European Parliament Election. Colours indicate winning party.}} |Source={{own}} |Author= Mwhite148 |Date=2010-10-23 |Permission= |other_versions= }} [[C |
File usage
The following pages on the English Wikipedia use this file (pages on other projects are not listed):
Global file usage
The following other wikis use this file:
- Usage on cy.wikipedia.org
- Usage on de.wikipedia.org
- Usage on fa.wikipedia.org
Metadata
Size of this preview:
525 × 599 pixels. Other resolutions:
210 × 240 pixels |
420 × 480 pixels |
673 × 768 pixels |
1,131 × 1,291 pixels.
Original file (1,131 × 1,291 pixels, file size: 32 KB, MIME type: image/png)
| This is a file from the
Wikimedia Commons. Information from its
description page there is shown below. Commons is a freely licensed media file repository. You can help. |
Summary
| Description |
English: A map of British constituencies used for the 2009 European Parliament Election. Colours indicate winning party. |
| Date | |
| Source | Own work |
| Author | Mwhite148 |
Licensing
| I, the copyright holder of this work, release this work into the
public domain. This applies worldwide. In some countries this may not be legally possible; if so: I grant anyone the right to use this work for any purpose, without any conditions, unless such conditions are required by law. |
File history
Click on a date/time to view the file as it appeared at that time.
| Date/Time | Thumbnail | Dimensions | User | Comment | |
|---|---|---|---|---|---|
| current | 12:20, 21 June 2015 |
| 1,131 × 1,291 (32 KB) | DrKay | removing brown line on part of Scottish coast |
| 15:33, 10 April 2015 |
| 1,131 × 1,291 (32 KB) | DrKay | parties ranked top to bottom in order of vote share per region | |
| 12:08, 28 May 2011 |
| 1,131 × 1,291 (64 KB) | Bastin | Correct NW England (Lib Dem was denominated yellow, which is SNP - not sure they have an MEP south of the border!). | |
| 15:02, 23 October 2010 |
| 1,131 × 1,291 (55 KB) | Mwhite148 | {{Information |Description={{en|1=A map of British constituencies used for the 2009 European Parliament Election. Colours indicate winning party.}} |Source={{own}} |Author= Mwhite148 |Date=2010-10-23 |Permission= |other_versions= }} [[C |
File usage
The following pages on the English Wikipedia use this file (pages on other projects are not listed):
Global file usage
The following other wikis use this file:
- Usage on cy.wikipedia.org
- Usage on de.wikipedia.org
- Usage on fa.wikipedia.org