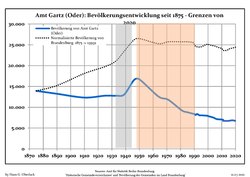
Development of population since 1875 within the current Boundaries (Blue Line: Population; Dotted Line: Comparison to Population development in Brandenburg state; Grey Background: Time of
Nazi Germany; Red Background: Time of communist
East Germany)
Recent Population Development and Projections (Population Development before Census 2011 (blue line); Recent Population Development according to the
Census in Germany in 2011 (blue bordered line); Official projections for 2005-2030 (yellow line); for 2020-2030 (green line); for 2017-2030 (scarlet line)
Amt Gartz (Oder): Population development within the current boundaries (2020)[2]
 Development of population since 1875 within the current Boundaries (Blue Line: Population; Dotted Line: Comparison to Population development in Brandenburg state; Grey Background: Time of Nazi Germany; Red Background: Time of communist East Germany)
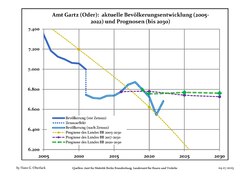 Recent Population Development and Projections (Population Development before Census 2011 (blue line); Recent Population Development according to the Census in Germany in 2011 (blue bordered line); Official projections for 2005-2030 (yellow line); for 2020-2030 (green line); for 2017-2030 (scarlet line)