| 2023 Oregon wildfires | |
|---|---|
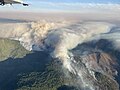
.jpg) Smoke from Oregon wildfires seen in a NASA image taken August 15 by the
Terra satellite | |
| Date(s) |
|
| Statistics | |
| Total fires | 1,731 |
| Total area | 259,725 acres (105,107 ha) |
| Map | |
Map of 2023 Oregon wildfires (
map data) | |
| Season | |
←
2022
2024 → | |
This article is a summary of the 2023 Oregon wildfire season, comprising the series of significant wildfires that have burned in the U.S. state of Oregon since the beginning of the calendar year. Fire season officially began in all areas of the state by July 1, according to the Oregon Department of Forestry (ODF). As of September 5, 2023 [update], the state had recorded 1,731 fires, which had burned a total of 159,991 acres (64,746 hectares). [1]
Outlook
Fire season in the Pacific Northwest often lasts from May until October. [2] The National Interagency Coordination Center, in its seasonal fire assessment and outlook released in July, forecast above-normal significant fire potential in the Pacific Northwest through September. [3] The August outlook continued this forecast, predicting that "Significant fire potential will be above average for the entire geographic area in August and September. In October, elevated risk of significant fires will shift west of the Cascades due to the likelihood of dry easterly winds in autumn. By November, significant fire risk will decrease back to normal (i.e., low) for the entire geographic area as cooler and wetter weather arrives." [4]: 6
All Oregon Department of Forestry districts declared the beginning of fire season by July 1. [5] The Northwest Coordination Center upgraded the region's preparedness level (referring to the availability of firefighting resources) from PL 1 to PL 2 on July 3, PL 3 on July 23, PL 4 on August 12, and PL5—the highest level—on August 19. [6]
Impacts
|
| This section needs expansion with: more information regarding fire season impacts. You can help by
adding to it. (August 2023) |
Highway closures and wildfire smoke affected businesses in the vicinity of the Smith River Complex fire, burning in northern California and southern Oregon. [7]
List of wildfires
The following is a list of Oregon wildfires in 2023 that have burned more than 1,000 acres (400 hectares), have resulted in casualties or significant damage to structures, or have otherwise been notable. Acreage and containment figures may not be up-to-date.
| Name | County | Acres | Start date | Containment date | Notes | Refs |
|---|---|---|---|---|---|---|
| Madeuce | Morrow | 2,160 | May 15 | May 18 | Human-caused. | [8] |
| Dillon Creek | Klamath | 3,119 | May 20 | June 6 | Caused by lightning. This fire was allowed to burn at a low intensity, within a confined footprint, for ecological benefits. Estimated cost of suppression is $1.38 million. | [9] [10] [8] |
| Hat Rock | Umatilla, Walla Walla (WA) | 16,816 | June 13 | June 17 | Cause under investigation. Burned in grass and sagebrush, causing evacuations as it burned into Washington. Estimated cost of suppression is $663,000. | [11] [12] [8] |
| Alder Creek | Wheeler | 1,551 | July 6 | July 15 | Cause under investigation. Estimated cost of suppression is $2 million. | [13] [14] [8] |
| Devil's Butte | Gilliam | 2,859 | July 10 | July 18 | Caused by lightning. Burned in rangelands and wheat fields, destroying two fire engines. Estimated cost of suppression is $800,000. | [15] [16] [8] |
| Flat | Curry | 34,242 | July 15 | 2023 | Human-caused; under investigation. Burning partially in the footprint of the 2002 Biscuit Fire. Estimated cost of suppression is $59 million. | [17] [18] [19] |
| Simnasho | Wasco | 1,280 | July 21 | Unknown | Cause unknown. Estimated cost of suppression is $2 million. | [20] [21] [19] |
| Golden | Klamath | 2,137 | July 22 | August 6 | Cause under investigation. 117 structures destroyed, including at least 43 homes. The fire also damaged six miles of fiber-optic cables and more than 100 power poles in Klamath County. Estimated cost of suppression is $8.5 million. | [22] [23] [24] [19] [25] |
| Bedrock | Lane | 31,590 | July 22 | October 4 | Cause under investigation. Estimated cost of suppression is $50.2 million. | [26] [27] [28] [19] [8] |
| Corbie | Harney, Malheur | 1,141 | August 1 | August 3 | Cause unknown. Estimated cost of suppression is $350,000. | [29] [30] [8] |
| Lookout | Lane, Linn | 25,754 | August 5 | October 11 | Caused by lightning. Evacuations in effect. Estimated cost of suppression is $18.2 million. | [31] [32] [8] |
| Smith River Complex | Curry, Josephine, Del Norte (CA) | 95,107 | August 15 | November 17 | Burning mostly in California. Caused by lightning. Consists of the Holiday, Diamond, Kelly, and Prescott fires, as well as many smaller fires. | [33] [34] |
| Camp Creek | Clackamas, Multnomah | 2,055 | August 24 | 2023 | Caused by lightning. Burning in the Bull Run Watershed in the Mount Hood National Forest. | [35] [36] [8] |
| Tyee Ridge Complex | Douglas | 7,945 | August 24 | 2023 | Consists of the Cougar Creek Fire, Tyee Mountain Fire, Big Tom Fire, and Lighthouse fires. | [37] [38] |
| Chilcoot | Douglas | 1,940 | August 24 | 2023 | Burning in the Umpqua National Forest. | [39] [40] |
| Anvil | Curry | 22,170 | August 25 | October | Burning in the Grassy Knob Wilderness. | [41] |
| Petes Lake | Lane | 3,254 | August 25 | 2023 | Burning in the Three Sisters Wilderness. | [42] [43] |
| Cottonwood Canyon | Sherman | 2,316 | August 29 | September 2 | Burned on both sides of the John Day River. | [44] [45] |
| Morgan | Lake | 2,289 | September 18 | 2023 | Burning in the Fremont–Winema National Forest. | [46] [47] |
Gallery
-
 The Flat Fire on July 17
 -
 The Bedrock Fire on August 1
 -
 The Camp Creek Fire on September 9


See also
References
- ^ "Wildland Fire Statistics". ODF Wildfire News. Oregon Department of Forestry. Archived from the original on July 20, 2023. Retrieved August 22, 2023.
- ^ "Oregon/Washington Fire Management". Bureau of Land Management. Department of the Interior. Archived from the original on June 19, 2023. Retrieved July 20, 2023.
- ^ North American Seasonal Fire Assessment and Outlook: Outlook Period July through September 2023 (PDF) (Report). National Interagency Coordination Center. July 12, 2023. Archived (PDF) from the original on July 20, 2023. Retrieved July 20, 2023.
- ^ "National Significant Wildland Fire Potential Outlook: Outlook Period – August through November 2023" (PDF). National Interagency Fire Center. August 1, 2023. Archived (PDF) from the original on August 4, 2023. Retrieved August 9, 2023.
- ^ "All ODF districts have entered fire season". ODF Wildfire News. Oregon Department of Forestry. July 5, 2023. Archived from the original on July 20, 2023. Retrieved July 20, 2023.
- ^ Northwest Preparedness Levels (PDF) (Report). Northwest Coordination Center. 2023. Archived (PDF) from the original on August 27, 2023. Retrieved August 22, 2023.
- ^ Hutcherson, Ella; Battaglia, Roman (August 26, 2023). "Tourist businesses heavily impacted by Smith River Complex fires". Oregon Public Broadcasting. Archived from the original on September 15, 2023. Retrieved September 15, 2023.
- ^ a b c d e f g h i 2023 Large Incidents Year-to-Date (ICS-209) (PDF) (Report). Northwest Interagency Coordination Center. August 7, 2023. Archived (PDF) from the original on January 23, 2023. Retrieved August 7, 2023.
- ^ Gailey, Brian (May 23, 2023). "Natural fire start offers fuels reduction opportunity; Dillon Creek Fire". Klamath Falls News. Archived from the original on July 19, 2023. Retrieved July 19, 2023.
- ^ "Dillon Creek fire fully contained; recent lightning sparks second blaze". Herald and News. June 8, 2023. Archived from the original on June 9, 2023. Retrieved July 20, 2023.
- ^ "Hat Rock Fire in Umatilla County grows to 15,000 acres; Evacuations continue". Central Oregon Daily News. June 14, 2023. Archived from the original on June 14, 2023. Retrieved June 20, 2023.
- ^ "Hat Rock Fire fully contained, Oregon officials said". Walla Walla Union-Bulletin. June 17, 2023. Archived from the original on June 29, 2023. Retrieved July 19, 2023.
- ^ "Alder Creek Fire 50% contained; Highway 19 fully reopened between Spray and Service Creek". Blue Mountain Eagle. July 10, 2023. Archived from the original on July 20, 2023. Retrieved July 20, 2023.
- ^ "Incident Management Situation Report" (PDF). National Interagency Fire Center. July 15, 2023. Archived (PDF) from the original on July 20, 2023. Retrieved July 20, 2023.
- ^ Plante, Aimee (July 11, 2023). "Devil's Butte Fire destroys 2 fire trucks as it spreads to 3,000 acres". KOIN. Archived from the original on July 20, 2023. Retrieved July 20, 2023.
- ^ "Incident Management Situation Report" (PDF). National Interagency Fire Center. July 18, 2023. Archived (PDF) from the original on July 20, 2023. Retrieved July 20, 2023.
- ^ "Flat Fire". InciWeb. Archived from the original on November 1, 2023. Retrieved July 31, 2023.
- ^ Battaglia, Roman (July 19, 2023). "Flat Fire spreading quickly in Southern Oregon, growing to almost 13,000 acres". Jefferson Public Radio. Oregon Public Broadcasting. Archived from the original on July 19, 2023. Retrieved July 19, 2023.
- ^ a b c d "Incident Management Situation Report" (PDF). National Interagency Coordination Center. August 3, 2023. Archived (PDF) from the original on August 1, 2023. Retrieved August 3, 2023.
- ^ "Simnasho Fire". Watch Duty. Archived from the original on July 22, 2023. Retrieved July 22, 2023.
- ^ "A wildfire burning on Warm Springs Reservation more than doubles overnight". Central Oregon Daily News. July 22, 2023. Archived from the original on July 22, 2023. Retrieved July 22, 2023.
- ^ "Golden Fire". Watch Duty. Archived from the original on July 23, 2023. Retrieved July 23, 2023.
- ^ "C.O., other task forces sent to Klamath County wildfire that's prompted Bly Mtn. evacuations, Conflagration Act". KTVZ. July 22, 2023. Archived from the original on July 23, 2023. Retrieved July 23, 2023.
- ^ "Golden Fire". InciWeb. Archived from the original on November 1, 2023. Retrieved July 31, 2023.
- ^ Taylor, Derrick Bryson (July 26, 2023). "Oregon Wildfire Destroys Dozens of Homes and Disrupts 911 Service". New York Times. Archived from the original on July 31, 2023. Retrieved August 3, 2023.
- ^ "Incident Information – Northwest Large Fire Information Summary". Northwest Interagency Coordination Center. Archived from the original on July 27, 2023. Retrieved July 24, 2023.
- ^ Bonham, Ryan (July 24, 2023). "Public asked to avoid Big Fall Creek Road due to Bedrock Fire activity". KEZI. Archived from the original on July 24, 2023. Retrieved July 24, 2023.
- ^ "Bedrock Fire". InciWeb. Archived from the original on August 1, 2023. Retrieved July 31, 2023.
- ^ "Corbie Fire". Watch Duty. Archived from the original on August 3, 2023. Retrieved August 3, 2023.
- ^ Gould, Mindy (August 2, 2023). "Corbie Fire update in Harney/Malheur County". Elkhorn Media Group. Archived from the original on August 3, 2023. Retrieved August 3, 2023.
- ^ "Lookout Fire". Watch Duty. Archived from the original on August 14, 2023. Retrieved August 14, 2023.
- ^ "Lookout Fire Information". InciWeb. Archived from the original on November 1, 2023. Retrieved August 14, 2023.
- ^ "Smith River Complex Information". Inciweb. Retrieved August 16, 2023.
- ^ "SRF Smith River Complex". Watch Duty. Archived from the original on August 17, 2023. Retrieved August 17, 2023.
- ^ "Camp Creek Fire". Watch Duty. Archived from the original on August 27, 2023. Retrieved August 27, 2023.
- ^ "Camp Creek Fire Information". InciWeb. Archived from the original on November 1, 2023. Retrieved May 13, 2024.
- ^ "Tyee Ridge Complex Information". InciWeb. Archived from the original on November 1, 2023. Retrieved June 4, 2024.
- ^ "Tyee Ridge Complex". Watch Duty. Archived from the original on August 28, 2023. Retrieved August 28, 2023.
- ^ "2023 Chilcoot Fire Information". InciWeb. Archived from the original on November 1, 2023. Retrieved August 30, 2023.
- ^ "Chilcoot/High Power Fire". Watch Duty. Archived from the original on August 30, 2023. Retrieved August 30, 2023.
- ^ "Anvil Fire Information". InciWeb. Archived from the original on November 1, 2023. Retrieved June 19, 2024.
- ^ "Petes Lake Fire Information". InciWeb. Archived from the original on November 1, 2023. Retrieved May 13, 2024.
- ^ "Petes Lake Fire". Watch Duty. Archived from the original on September 29, 2023. Retrieved September 15, 2023.
- ^ "Cottonwood Canyon Fire". Watch Duty. Archived from the original on August 31, 2023. Retrieved August 31, 2023.
- ^ "2,300-acre north-central Oregon fire 40% contained; Hwy. 206, Cottonwood Canyon State Park reopen". KTVZ. August 30, 2023. Archived from the original on August 31, 2023. Retrieved August 31, 2023.
- ^ "Morgan Fire". Watch Duty. Archived from the original on September 26, 2023. Retrieved September 26, 2023.
- ^ "Morgan Fire Information". InciWeb. Archived from the original on November 1, 2023. Retrieved September 26, 2023.
External links
| 2023 Oregon wildfires | |
|---|---|
|
Smoke from Oregon wildfires seen in a NASA image taken August 15 by the
Terra satellite | |
| Date(s) |
|
| Statistics | |
| Total fires | 1,731 |
| Total area | 259,725 acres (105,107 ha) |
| Map | |
Map of 2023 Oregon wildfires (
map data) | |
| Season | |
←
2022
2024 → | |
This article is a summary of the 2023 Oregon wildfire season, comprising the series of significant wildfires that have burned in the U.S. state of Oregon since the beginning of the calendar year. Fire season officially began in all areas of the state by July 1, according to the Oregon Department of Forestry (ODF). As of September 5, 2023 [update], the state had recorded 1,731 fires, which had burned a total of 159,991 acres (64,746 hectares). [1]
Outlook
Fire season in the Pacific Northwest often lasts from May until October. [2] The National Interagency Coordination Center, in its seasonal fire assessment and outlook released in July, forecast above-normal significant fire potential in the Pacific Northwest through September. [3] The August outlook continued this forecast, predicting that "Significant fire potential will be above average for the entire geographic area in August and September. In October, elevated risk of significant fires will shift west of the Cascades due to the likelihood of dry easterly winds in autumn. By November, significant fire risk will decrease back to normal (i.e., low) for the entire geographic area as cooler and wetter weather arrives." [4]: 6
All Oregon Department of Forestry districts declared the beginning of fire season by July 1. [5] The Northwest Coordination Center upgraded the region's preparedness level (referring to the availability of firefighting resources) from PL 1 to PL 2 on July 3, PL 3 on July 23, PL 4 on August 12, and PL5—the highest level—on August 19. [6]
Impacts
|
| This section needs expansion with: more information regarding fire season impacts. You can help by
adding to it. (August 2023) |
Highway closures and wildfire smoke affected businesses in the vicinity of the Smith River Complex fire, burning in northern California and southern Oregon. [7]
List of wildfires
The following is a list of Oregon wildfires in 2023 that have burned more than 1,000 acres (400 hectares), have resulted in casualties or significant damage to structures, or have otherwise been notable. Acreage and containment figures may not be up-to-date.
| Name | County | Acres | Start date | Containment date | Notes | Refs |
|---|---|---|---|---|---|---|
| Madeuce | Morrow | 2,160 | May 15 | May 18 | Human-caused. | [8] |
| Dillon Creek | Klamath | 3,119 | May 20 | June 6 | Caused by lightning. This fire was allowed to burn at a low intensity, within a confined footprint, for ecological benefits. Estimated cost of suppression is $1.38 million. | [9] [10] [8] |
| Hat Rock | Umatilla, Walla Walla (WA) | 16,816 | June 13 | June 17 | Cause under investigation. Burned in grass and sagebrush, causing evacuations as it burned into Washington. Estimated cost of suppression is $663,000. | [11] [12] [8] |
| Alder Creek | Wheeler | 1,551 | July 6 | July 15 | Cause under investigation. Estimated cost of suppression is $2 million. | [13] [14] [8] |
| Devil's Butte | Gilliam | 2,859 | July 10 | July 18 | Caused by lightning. Burned in rangelands and wheat fields, destroying two fire engines. Estimated cost of suppression is $800,000. | [15] [16] [8] |
| Flat | Curry | 34,242 | July 15 | 2023 | Human-caused; under investigation. Burning partially in the footprint of the 2002 Biscuit Fire. Estimated cost of suppression is $59 million. | [17] [18] [19] |
| Simnasho | Wasco | 1,280 | July 21 | Unknown | Cause unknown. Estimated cost of suppression is $2 million. | [20] [21] [19] |
| Golden | Klamath | 2,137 | July 22 | August 6 | Cause under investigation. 117 structures destroyed, including at least 43 homes. The fire also damaged six miles of fiber-optic cables and more than 100 power poles in Klamath County. Estimated cost of suppression is $8.5 million. | [22] [23] [24] [19] [25] |
| Bedrock | Lane | 31,590 | July 22 | October 4 | Cause under investigation. Estimated cost of suppression is $50.2 million. | [26] [27] [28] [19] [8] |
| Corbie | Harney, Malheur | 1,141 | August 1 | August 3 | Cause unknown. Estimated cost of suppression is $350,000. | [29] [30] [8] |
| Lookout | Lane, Linn | 25,754 | August 5 | October 11 | Caused by lightning. Evacuations in effect. Estimated cost of suppression is $18.2 million. | [31] [32] [8] |
| Smith River Complex | Curry, Josephine, Del Norte (CA) | 95,107 | August 15 | November 17 | Burning mostly in California. Caused by lightning. Consists of the Holiday, Diamond, Kelly, and Prescott fires, as well as many smaller fires. | [33] [34] |
| Camp Creek | Clackamas, Multnomah | 2,055 | August 24 | 2023 | Caused by lightning. Burning in the Bull Run Watershed in the Mount Hood National Forest. | [35] [36] [8] |
| Tyee Ridge Complex | Douglas | 7,945 | August 24 | 2023 | Consists of the Cougar Creek Fire, Tyee Mountain Fire, Big Tom Fire, and Lighthouse fires. | [37] [38] |
| Chilcoot | Douglas | 1,940 | August 24 | 2023 | Burning in the Umpqua National Forest. | [39] [40] |
| Anvil | Curry | 22,170 | August 25 | October | Burning in the Grassy Knob Wilderness. | [41] |
| Petes Lake | Lane | 3,254 | August 25 | 2023 | Burning in the Three Sisters Wilderness. | [42] [43] |
| Cottonwood Canyon | Sherman | 2,316 | August 29 | September 2 | Burned on both sides of the John Day River. | [44] [45] |
| Morgan | Lake | 2,289 | September 18 | 2023 | Burning in the Fremont–Winema National Forest. | [46] [47] |
Gallery
-
The Flat Fire on July 17
-
The Bedrock Fire on August 1
-
The Camp Creek Fire on September 9
See also
References
- ^ "Wildland Fire Statistics". ODF Wildfire News. Oregon Department of Forestry. Archived from the original on July 20, 2023. Retrieved August 22, 2023.
- ^ "Oregon/Washington Fire Management". Bureau of Land Management. Department of the Interior. Archived from the original on June 19, 2023. Retrieved July 20, 2023.
- ^ North American Seasonal Fire Assessment and Outlook: Outlook Period July through September 2023 (PDF) (Report). National Interagency Coordination Center. July 12, 2023. Archived (PDF) from the original on July 20, 2023. Retrieved July 20, 2023.
- ^ "National Significant Wildland Fire Potential Outlook: Outlook Period – August through November 2023" (PDF). National Interagency Fire Center. August 1, 2023. Archived (PDF) from the original on August 4, 2023. Retrieved August 9, 2023.
- ^ "All ODF districts have entered fire season". ODF Wildfire News. Oregon Department of Forestry. July 5, 2023. Archived from the original on July 20, 2023. Retrieved July 20, 2023.
- ^ Northwest Preparedness Levels (PDF) (Report). Northwest Coordination Center. 2023. Archived (PDF) from the original on August 27, 2023. Retrieved August 22, 2023.
- ^ Hutcherson, Ella; Battaglia, Roman (August 26, 2023). "Tourist businesses heavily impacted by Smith River Complex fires". Oregon Public Broadcasting. Archived from the original on September 15, 2023. Retrieved September 15, 2023.
- ^ a b c d e f g h i 2023 Large Incidents Year-to-Date (ICS-209) (PDF) (Report). Northwest Interagency Coordination Center. August 7, 2023. Archived (PDF) from the original on January 23, 2023. Retrieved August 7, 2023.
- ^ Gailey, Brian (May 23, 2023). "Natural fire start offers fuels reduction opportunity; Dillon Creek Fire". Klamath Falls News. Archived from the original on July 19, 2023. Retrieved July 19, 2023.
- ^ "Dillon Creek fire fully contained; recent lightning sparks second blaze". Herald and News. June 8, 2023. Archived from the original on June 9, 2023. Retrieved July 20, 2023.
- ^ "Hat Rock Fire in Umatilla County grows to 15,000 acres; Evacuations continue". Central Oregon Daily News. June 14, 2023. Archived from the original on June 14, 2023. Retrieved June 20, 2023.
- ^ "Hat Rock Fire fully contained, Oregon officials said". Walla Walla Union-Bulletin. June 17, 2023. Archived from the original on June 29, 2023. Retrieved July 19, 2023.
- ^ "Alder Creek Fire 50% contained; Highway 19 fully reopened between Spray and Service Creek". Blue Mountain Eagle. July 10, 2023. Archived from the original on July 20, 2023. Retrieved July 20, 2023.
- ^ "Incident Management Situation Report" (PDF). National Interagency Fire Center. July 15, 2023. Archived (PDF) from the original on July 20, 2023. Retrieved July 20, 2023.
- ^ Plante, Aimee (July 11, 2023). "Devil's Butte Fire destroys 2 fire trucks as it spreads to 3,000 acres". KOIN. Archived from the original on July 20, 2023. Retrieved July 20, 2023.
- ^ "Incident Management Situation Report" (PDF). National Interagency Fire Center. July 18, 2023. Archived (PDF) from the original on July 20, 2023. Retrieved July 20, 2023.
- ^ "Flat Fire". InciWeb. Archived from the original on November 1, 2023. Retrieved July 31, 2023.
- ^ Battaglia, Roman (July 19, 2023). "Flat Fire spreading quickly in Southern Oregon, growing to almost 13,000 acres". Jefferson Public Radio. Oregon Public Broadcasting. Archived from the original on July 19, 2023. Retrieved July 19, 2023.
- ^ a b c d "Incident Management Situation Report" (PDF). National Interagency Coordination Center. August 3, 2023. Archived (PDF) from the original on August 1, 2023. Retrieved August 3, 2023.
- ^ "Simnasho Fire". Watch Duty. Archived from the original on July 22, 2023. Retrieved July 22, 2023.
- ^ "A wildfire burning on Warm Springs Reservation more than doubles overnight". Central Oregon Daily News. July 22, 2023. Archived from the original on July 22, 2023. Retrieved July 22, 2023.
- ^ "Golden Fire". Watch Duty. Archived from the original on July 23, 2023. Retrieved July 23, 2023.
- ^ "C.O., other task forces sent to Klamath County wildfire that's prompted Bly Mtn. evacuations, Conflagration Act". KTVZ. July 22, 2023. Archived from the original on July 23, 2023. Retrieved July 23, 2023.
- ^ "Golden Fire". InciWeb. Archived from the original on November 1, 2023. Retrieved July 31, 2023.
- ^ Taylor, Derrick Bryson (July 26, 2023). "Oregon Wildfire Destroys Dozens of Homes and Disrupts 911 Service". New York Times. Archived from the original on July 31, 2023. Retrieved August 3, 2023.
- ^ "Incident Information – Northwest Large Fire Information Summary". Northwest Interagency Coordination Center. Archived from the original on July 27, 2023. Retrieved July 24, 2023.
- ^ Bonham, Ryan (July 24, 2023). "Public asked to avoid Big Fall Creek Road due to Bedrock Fire activity". KEZI. Archived from the original on July 24, 2023. Retrieved July 24, 2023.
- ^ "Bedrock Fire". InciWeb. Archived from the original on August 1, 2023. Retrieved July 31, 2023.
- ^ "Corbie Fire". Watch Duty. Archived from the original on August 3, 2023. Retrieved August 3, 2023.
- ^ Gould, Mindy (August 2, 2023). "Corbie Fire update in Harney/Malheur County". Elkhorn Media Group. Archived from the original on August 3, 2023. Retrieved August 3, 2023.
- ^ "Lookout Fire". Watch Duty. Archived from the original on August 14, 2023. Retrieved August 14, 2023.
- ^ "Lookout Fire Information". InciWeb. Archived from the original on November 1, 2023. Retrieved August 14, 2023.
- ^ "Smith River Complex Information". Inciweb. Retrieved August 16, 2023.
- ^ "SRF Smith River Complex". Watch Duty. Archived from the original on August 17, 2023. Retrieved August 17, 2023.
- ^ "Camp Creek Fire". Watch Duty. Archived from the original on August 27, 2023. Retrieved August 27, 2023.
- ^ "Camp Creek Fire Information". InciWeb. Archived from the original on November 1, 2023. Retrieved May 13, 2024.
- ^ "Tyee Ridge Complex Information". InciWeb. Archived from the original on November 1, 2023. Retrieved June 4, 2024.
- ^ "Tyee Ridge Complex". Watch Duty. Archived from the original on August 28, 2023. Retrieved August 28, 2023.
- ^ "2023 Chilcoot Fire Information". InciWeb. Archived from the original on November 1, 2023. Retrieved August 30, 2023.
- ^ "Chilcoot/High Power Fire". Watch Duty. Archived from the original on August 30, 2023. Retrieved August 30, 2023.
- ^ "Anvil Fire Information". InciWeb. Archived from the original on November 1, 2023. Retrieved June 19, 2024.
- ^ "Petes Lake Fire Information". InciWeb. Archived from the original on November 1, 2023. Retrieved May 13, 2024.
- ^ "Petes Lake Fire". Watch Duty. Archived from the original on September 29, 2023. Retrieved September 15, 2023.
- ^ "Cottonwood Canyon Fire". Watch Duty. Archived from the original on August 31, 2023. Retrieved August 31, 2023.
- ^ "2,300-acre north-central Oregon fire 40% contained; Hwy. 206, Cottonwood Canyon State Park reopen". KTVZ. August 30, 2023. Archived from the original on August 31, 2023. Retrieved August 31, 2023.
- ^ "Morgan Fire". Watch Duty. Archived from the original on September 26, 2023. Retrieved September 26, 2023.
- ^ "Morgan Fire Information". InciWeb. Archived from the original on November 1, 2023. Retrieved September 26, 2023.