From Wikipedia, the free encyclopedia
1994 European Parliament election in Germany
[1]|
|
|
| Turnout | 60.0% |
|---|
|
|
First party
|
Second party
|
Third party
|
|
|
|
|
|
| Party
|
CDU/CSU
|
SPD
|
Greens
|
| Seats before
|
32
|
31
|
8
|
| Seats won
|
47
|
40
|
12
|
| Seat change
|
 15 15
|
9
|
4
|
| Popular vote
|
13,739,447
|
11,389,697
|
3,563,268
|
| Percentage
|
38.8%
|
32,2%
|
10.1%
|
| Swing
|
1.1%
|
 5.1% 5.1%
|
1.7%
|
|
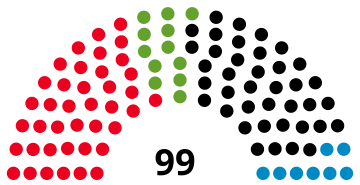
An election of the
delegation from
Germany to the
European Parliament was held in 1994.
Results
 |
|---|
| Party | Votes | % | Seats | +/– |
|---|
|
Social Democratic Party | 11,389,697 | 32.16 | 40 | +9 |
|
Christian Democratic Union | 11,346,073 | 32.04 | 39 | +14 |
|
Alliance 90/The Greens | 3,563,268 | 10.06 | 12 | +5 |
|
Christian Social Union | 2,393,374 | 6.76 | 8 | +1 |
|
Party of Democratic Socialism | 1,670,316 | 4.72 | 0 | New |
|
Free Democratic Party | 1,442,857 | 4.07 | 0 | –4 |
|
The Republicans | 1,387,070 | 3.92 | 0 | –6 |
|
League of Free Citizens | 385,676 | 1.09 | 0 | New |
|
The Grays – Gray Panthers | 275,866 | 0.78 | 0 | New |
|
Ecological Democratic Party | 273,776 | 0.77 | 0 | 0 |
|
Car-drivers' and Citizens' Interests Party | 231,265 | 0.65 | 0 | New |
|
Statt Party | 168,738 | 0.48 | 0 | New |
|
Party of the Willing to Work and Socially Vulnerable | 127,104 | 0.36 | 0 | New |
|
Bavaria Party | 110,778 | 0.31 | 0 | 0 |
|
New Forum | 107,615 | 0.30 | 0 | New |
|
Party of Bible-abiding Christians | 93,210 | 0.26 | 0 | New |
|
Natural Law Party | 92,031 | 0.26 | 0 | New |
|
German Social Union | 80,618 | 0.23 | 0 | New |
|
National Democratic Party | 77,227 | 0.22 | 0 | 0 |
|
Christian Centre | 66,766 | 0.19 | 0 | 0 |
|
Christian League | 40,115 | 0.11 | 0 | 0 |
|
Die Unregierbaren – Autonome Liste | 37,672 | 0.11 | 0 | New |
|
Bürgerrechtsbewegung Solidarität | 23,851 | 0.07 | 0 | New |
|
Platform Europe for Workers and Democracy | 12,992 | 0.04 | 0 | 0 |
|
Federation of Socialist Workers | 10,678 | 0.03 | 0 | 0 |
|
Family Party of Germany | 2,781 | 0.01 | 0 | New |
| Total | 35,411,414 | 100.00 | 99 | +18 |
|
| Valid votes | 35,411,414 | 97.56 | |
|---|
| Invalid/blank votes | 884,115 | 2.44 | |
|---|
| Total votes | 36,295,529 | 100.00 | |
|---|
| Registered voters/turnout | 60,473,927 | 60.02 | |
|---|
| Source:
Federal Statistics Office |
References

