Perquimans County | |
|---|---|
 | |
 Seal Logo | |
 Location within the U.S. state of
North Carolina | |
 North Carolina's location within the
U.S. | |
| Coordinates: 36°11′N 76°24′W / 36.18°N 76.40°W | |
| Country | |
| State | |
| Founded | 1668 |
| Named for | Yeopim word meaning “The land of beautiful women” [1] |
| Seat | Hertford |
| Largest community | Hertford |
| Area | |
| • Total | 328.93 sq mi (851.9 km2) |
| • Land | 247.17 sq mi (640.2 km2) |
| • Water | 81.76 sq mi (211.8 km2) 24.86% |
| Population (
2020) | |
| • Total | 13,005 |
| • Estimate (2023) | 13,377 |
| • Density | 52.62/sq mi (20.32/km2) |
| Time zone | UTC−5 ( Eastern) |
| • Summer ( DST) | UTC−4 ( EDT) |
| Congressional district | 1st |
| Website |
www |
Perquimans County ( /pɜːrˈkwɪmənz/ pur-KWIM-unz) [2] is a county located in the U.S. state of North Carolina. As of the 2020 census, the population was 13,005. [3] Its county seat is Hertford. [4] The Harvey Point Defense Testing Activity facility is located in Perquimans County.
History
The county was originally created as Berkeley Precinct. It was renamed Perquimans Precinct around 1684 and gained county status in 1739. [5] The largest community and county seat is Hertford.
-
 Courthouse and the Jim "Catfish" Hunter Memorial
 -
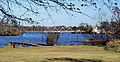 The Perquimans River and the "S" Bridge.


Geography
According to the U.S. Census Bureau, the county has a total area of 328.93 square miles (851.9 km2), of which 247.17 square miles (640.2 km2) is land and 81.76 square miles (211.8 km2) (24.86%) is water. [6]
Major water bodies
Adjacent Counties
- Tyrrell County – south
- Washington County – south
- Pasquotank County – east
- Chowan County – southwest
- Gates County – northwest
Major highways
Demographics
| Census | Pop. | Note | %± |
|---|---|---|---|
| 1790 | 5,439 | — | |
| 1800 | 5,708 | 4.9% | |
| 1810 | 6,052 | 6.0% | |
| 1820 | 6,857 | 13.3% | |
| 1830 | 7,419 | 8.2% | |
| 1840 | 7,346 | −1.0% | |
| 1850 | 7,332 | −0.2% | |
| 1860 | 7,238 | −1.3% | |
| 1870 | 7,945 | 9.8% | |
| 1880 | 9,466 | 19.1% | |
| 1890 | 9,293 | −1.8% | |
| 1900 | 10,091 | 8.6% | |
| 1910 | 11,054 | 9.5% | |
| 1920 | 11,137 | 0.8% | |
| 1930 | 10,668 | −4.2% | |
| 1940 | 9,773 | −8.4% | |
| 1950 | 9,602 | −1.7% | |
| 1960 | 9,178 | −4.4% | |
| 1970 | 8,351 | −9.0% | |
| 1980 | 9,486 | 13.6% | |
| 1990 | 10,447 | 10.1% | |
| 2000 | 11,368 | 8.8% | |
| 2010 | 13,453 | 18.3% | |
| 2020 | 13,005 | −3.3% | |
| 2023 (est.) | 13,377 | [3] | 2.9% |
| U.S. Decennial Census
[7] 1790–1960 [8] 1900–1990 [9] 1990–2000 [10] 2010 [11] 2020 [3] | |||
2020 census
| Race | Number | Percentage |
|---|---|---|
| White (non-Hispanic) | 9,333 | 71.76% |
| Black or African American (non-Hispanic) | 2,686 | 20.65% |
| Native American | 35 | 0.27% |
| Asian | 36 | 0.28% |
| Pacific Islander | 7 | 0.05% |
| Other/Mixed | 599 | 4.61% |
| Hispanic or Latino | 309 | 2.38% |
As of the 2020 census, there were 13,005 people, 5,936 households, and 4,023 families residing in the county.
2000 census
At the 2000 census, [13] there were 11,368 people, 4,645 households, and 3,376 families residing in the county. The population density was 46 people per square mile (18 people/km2). There were 6,043 housing units at an average density of 24 units per square mile (9.3 units/km2). The racial makeup of the county was 70.82% White, 27.99% Black or African American, 0.18% Native American, 0.21% Asian, 0.03% Pacific Islander, 0.13% from other races, and 0.64% from two or more races. 0.60% of the population were Hispanic or Latino of any race. There were 4,645 households, of which 28.20% had children under the age of 18 living with them, 56.50% were married couples living together, 12.60% had a female householder with no husband present, and 27.30% were non-families. 24.10% of all households were made up of individuals, and 11.90% had someone living alone who was 65 years of age or older. The average household size was 2.42 and the average family size was 2.86.
23.00% of the population were under the age of 18, 6.80% from 18 to 24, 24.40% from 25 to 44, 26.60% from 45 to 64, and 19.30% who were 65 years of age or older. The median age was 42 years. For every 100 females there were 91.30 males. For every 100 females age 18 and over, there were 87.50 males.
The median household income was $29,538 and the median family income was $35,212. Males had a median income of $27,251 compared with $18,728 for females. The per capita income for the county was $15,728. About 13.90% of families and 17.90% of the population were below the poverty line, including 27.20% of those under age 18 and 15.80% of those age 65 or over.
Government and politics
Perquimans County is a member of the Albemarle Commission regional council of governments.
| Year | Republican | Democratic | Third party | |||
|---|---|---|---|---|---|---|
| No. | % | No. | % | No. | % | |
| 2020 | 4,903 | 65.51% | 2,492 | 33.30% | 89 | 1.19% |
| 2016 | 4,177 | 62.27% | 2,319 | 34.57% | 212 | 3.16% |
| 2012 | 3,822 | 57.46% | 2,759 | 41.48% | 71 | 1.07% |
| 2008 | 3,678 | 56.58% | 2,772 | 42.64% | 51 | 0.78% |
| 2004 | 2,965 | 59.80% | 1,971 | 39.75% | 22 | 0.44% |
| 2000 | 2,230 | 51.79% | 2,033 | 47.21% | 43 | 1.00% |
| 1996 | 1,561 | 38.88% | 2,069 | 51.53% | 385 | 9.59% |
| 1992 | 1,429 | 36.85% | 1,818 | 46.88% | 631 | 16.27% |
| 1988 | 1,781 | 53.32% | 1,543 | 46.20% | 16 | 0.48% |
| 1984 | 1,939 | 57.28% | 1,441 | 42.57% | 5 | 0.15% |
| 1980 | 1,210 | 42.40% | 1,560 | 54.66% | 84 | 2.94% |
| 1976 | 909 | 35.23% | 1,666 | 64.57% | 5 | 0.19% |
| 1972 | 1,299 | 62.57% | 723 | 34.83% | 54 | 2.60% |
| 1968 | 468 | 15.37% | 1,023 | 33.60% | 1,554 | 51.03% |
| 1964 | 941 | 39.22% | 1,458 | 60.78% | 0 | 0.00% |
| 1960 | 637 | 30.38% | 1,460 | 69.62% | 0 | 0.00% |
| 1956 | 709 | 40.96% | 1,022 | 59.04% | 0 | 0.00% |
| 1952 | 644 | 34.09% | 1,245 | 65.91% | 0 | 0.00% |
| 1948 | 135 | 12.74% | 849 | 80.09% | 76 | 7.17% |
| 1944 | 266 | 21.70% | 960 | 78.30% | 0 | 0.00% |
| 1940 | 228 | 16.24% | 1,176 | 83.76% | 0 | 0.00% |
| 1936 | 161 | 14.24% | 970 | 85.76% | 0 | 0.00% |
| 1932 | 225 | 14.93% | 1,280 | 84.94% | 2 | 0.13% |
| 1928 | 600 | 49.63% | 609 | 50.37% | 0 | 0.00% |
| 1924 | 295 | 34.58% | 550 | 64.48% | 8 | 0.94% |
| 1920 | 487 | 31.85% | 1,042 | 68.15% | 0 | 0.00% |
| 1916 | 288 | 30.84% | 645 | 69.06% | 1 | 0.11% |
| 1912 | 228 | 24.81% | 647 | 70.40% | 44 | 4.79% |
Education
The county is served by Perquimans County Schools.
Communities

Towns
Unincorporated communities
Townships
- Belvidere
- Bethel
- Hertford
- New Hope
- Parkville
Notable people
- Janice Cole, U.S. Attorney
- Catfish Hunter, professional baseball pitcher for the Kansas City/Oakland A's and New York Yankees
- Wolfman Jack, radio personality
See also
- List of counties in North Carolina
- National Register of Historic Places listings in Perquimans County, North Carolina
References
- ^ "Perquimans County, North Carolina". www.carolana.com. Retrieved August 30, 2022.
- ^ "NC Pronunciation Guide". WRAL. Retrieved August 16, 2023.
- ^ a b c "QuickFacts: Perquimans County, North Carolina". United States Census Bureau. Retrieved March 22, 2024.
- ^ "Find a County". National Association of Counties. Retrieved June 7, 2011.
- ^ "North Carolina: Individual County Chronologies". North Carolina Atlas of Historical County Boundaries. The Newberry Library. 2009. Archived from the original on March 4, 2016. Retrieved January 25, 2015.
- ^ "2020 County Gazetteer Files – North Carolina". United States Census Bureau. August 23, 2022. Retrieved September 9, 2023.
- ^ "U.S. Decennial Census". United States Census Bureau. Retrieved January 18, 2015.
- ^ "Historical Census Browser". University of Virginia Library. Retrieved January 18, 2015.
- ^ Forstall, Richard L., ed. (March 27, 1995). "Population of Counties by Decennial Census: 1900 to 1990". United States Census Bureau. Retrieved January 18, 2015.
- ^ "Census 2000 PHC-T-4. Ranking Tables for Counties: 1990 and 2000" (PDF). United States Census Bureau. April 2, 2001. Archived (PDF) from the original on March 27, 2010. Retrieved January 18, 2015.
- ^ "State & County QuickFacts". United States Census Bureau. Archived from the original on June 7, 2011. Retrieved October 29, 2013.
- ^ "Explore Census Data". data.census.gov. Retrieved December 23, 2021.
- ^ "U.S. Census website". United States Census Bureau. Retrieved January 31, 2008.
- ^ Leip, David. "Dave Leip's Atlas of U.S. Presidential Elections". uselectionatlas.org. Retrieved March 17, 2018.
External links
 Geographic data related to
Perquimans County, North Carolina at
OpenStreetMap
Geographic data related to
Perquimans County, North Carolina at
OpenStreetMap- Official website
- NCGenWeb Perquimans County , genealogy resources for the county
Places adjacent to Perquimans County, North Carolina | ||||||||||||||||
|---|---|---|---|---|---|---|---|---|---|---|---|---|---|---|---|---|
| ||||||||||||||||
Municipalities and communities of
Perquimans County, North Carolina, United States | ||
|---|---|---|
| Towns |  | |
|
Unincorporated communities | ||
| International | |
|---|---|
| National | |
| Other | |
Perquimans County | |
|---|---|
|
| |
|
Seal Logo | |
|
Location within the U.S. state of
North Carolina | |
|
North Carolina's location within the
U.S. | |
| Coordinates: 36°11′N 76°24′W / 36.18°N 76.40°W | |
| Country | |
| State | |
| Founded | 1668 |
| Named for | Yeopim word meaning “The land of beautiful women” [1] |
| Seat | Hertford |
| Largest community | Hertford |
| Area | |
| • Total | 328.93 sq mi (851.9 km2) |
| • Land | 247.17 sq mi (640.2 km2) |
| • Water | 81.76 sq mi (211.8 km2) 24.86% |
| Population (
2020) | |
| • Total | 13,005 |
| • Estimate (2023) | 13,377 |
| • Density | 52.62/sq mi (20.32/km2) |
| Time zone | UTC−5 ( Eastern) |
| • Summer ( DST) | UTC−4 ( EDT) |
| Congressional district | 1st |
| Website |
www |
Perquimans County ( /pɜːrˈkwɪmənz/ pur-KWIM-unz) [2] is a county located in the U.S. state of North Carolina. As of the 2020 census, the population was 13,005. [3] Its county seat is Hertford. [4] The Harvey Point Defense Testing Activity facility is located in Perquimans County.
History
The county was originally created as Berkeley Precinct. It was renamed Perquimans Precinct around 1684 and gained county status in 1739. [5] The largest community and county seat is Hertford.
-
Courthouse and the Jim "Catfish" Hunter Memorial
-
The Perquimans River and the "S" Bridge.
Geography
According to the U.S. Census Bureau, the county has a total area of 328.93 square miles (851.9 km2), of which 247.17 square miles (640.2 km2) is land and 81.76 square miles (211.8 km2) (24.86%) is water. [6]
Major water bodies
Adjacent Counties
- Tyrrell County – south
- Washington County – south
- Pasquotank County – east
- Chowan County – southwest
- Gates County – northwest
Major highways
Demographics
| Census | Pop. | Note | %± |
|---|---|---|---|
| 1790 | 5,439 | — | |
| 1800 | 5,708 | 4.9% | |
| 1810 | 6,052 | 6.0% | |
| 1820 | 6,857 | 13.3% | |
| 1830 | 7,419 | 8.2% | |
| 1840 | 7,346 | −1.0% | |
| 1850 | 7,332 | −0.2% | |
| 1860 | 7,238 | −1.3% | |
| 1870 | 7,945 | 9.8% | |
| 1880 | 9,466 | 19.1% | |
| 1890 | 9,293 | −1.8% | |
| 1900 | 10,091 | 8.6% | |
| 1910 | 11,054 | 9.5% | |
| 1920 | 11,137 | 0.8% | |
| 1930 | 10,668 | −4.2% | |
| 1940 | 9,773 | −8.4% | |
| 1950 | 9,602 | −1.7% | |
| 1960 | 9,178 | −4.4% | |
| 1970 | 8,351 | −9.0% | |
| 1980 | 9,486 | 13.6% | |
| 1990 | 10,447 | 10.1% | |
| 2000 | 11,368 | 8.8% | |
| 2010 | 13,453 | 18.3% | |
| 2020 | 13,005 | −3.3% | |
| 2023 (est.) | 13,377 | [3] | 2.9% |
| U.S. Decennial Census
[7] 1790–1960 [8] 1900–1990 [9] 1990–2000 [10] 2010 [11] 2020 [3] | |||
2020 census
| Race | Number | Percentage |
|---|---|---|
| White (non-Hispanic) | 9,333 | 71.76% |
| Black or African American (non-Hispanic) | 2,686 | 20.65% |
| Native American | 35 | 0.27% |
| Asian | 36 | 0.28% |
| Pacific Islander | 7 | 0.05% |
| Other/Mixed | 599 | 4.61% |
| Hispanic or Latino | 309 | 2.38% |
As of the 2020 census, there were 13,005 people, 5,936 households, and 4,023 families residing in the county.
2000 census
At the 2000 census, [13] there were 11,368 people, 4,645 households, and 3,376 families residing in the county. The population density was 46 people per square mile (18 people/km2). There were 6,043 housing units at an average density of 24 units per square mile (9.3 units/km2). The racial makeup of the county was 70.82% White, 27.99% Black or African American, 0.18% Native American, 0.21% Asian, 0.03% Pacific Islander, 0.13% from other races, and 0.64% from two or more races. 0.60% of the population were Hispanic or Latino of any race. There were 4,645 households, of which 28.20% had children under the age of 18 living with them, 56.50% were married couples living together, 12.60% had a female householder with no husband present, and 27.30% were non-families. 24.10% of all households were made up of individuals, and 11.90% had someone living alone who was 65 years of age or older. The average household size was 2.42 and the average family size was 2.86.
23.00% of the population were under the age of 18, 6.80% from 18 to 24, 24.40% from 25 to 44, 26.60% from 45 to 64, and 19.30% who were 65 years of age or older. The median age was 42 years. For every 100 females there were 91.30 males. For every 100 females age 18 and over, there were 87.50 males.
The median household income was $29,538 and the median family income was $35,212. Males had a median income of $27,251 compared with $18,728 for females. The per capita income for the county was $15,728. About 13.90% of families and 17.90% of the population were below the poverty line, including 27.20% of those under age 18 and 15.80% of those age 65 or over.
Government and politics
Perquimans County is a member of the Albemarle Commission regional council of governments.
| Year | Republican | Democratic | Third party | |||
|---|---|---|---|---|---|---|
| No. | % | No. | % | No. | % | |
| 2020 | 4,903 | 65.51% | 2,492 | 33.30% | 89 | 1.19% |
| 2016 | 4,177 | 62.27% | 2,319 | 34.57% | 212 | 3.16% |
| 2012 | 3,822 | 57.46% | 2,759 | 41.48% | 71 | 1.07% |
| 2008 | 3,678 | 56.58% | 2,772 | 42.64% | 51 | 0.78% |
| 2004 | 2,965 | 59.80% | 1,971 | 39.75% | 22 | 0.44% |
| 2000 | 2,230 | 51.79% | 2,033 | 47.21% | 43 | 1.00% |
| 1996 | 1,561 | 38.88% | 2,069 | 51.53% | 385 | 9.59% |
| 1992 | 1,429 | 36.85% | 1,818 | 46.88% | 631 | 16.27% |
| 1988 | 1,781 | 53.32% | 1,543 | 46.20% | 16 | 0.48% |
| 1984 | 1,939 | 57.28% | 1,441 | 42.57% | 5 | 0.15% |
| 1980 | 1,210 | 42.40% | 1,560 | 54.66% | 84 | 2.94% |
| 1976 | 909 | 35.23% | 1,666 | 64.57% | 5 | 0.19% |
| 1972 | 1,299 | 62.57% | 723 | 34.83% | 54 | 2.60% |
| 1968 | 468 | 15.37% | 1,023 | 33.60% | 1,554 | 51.03% |
| 1964 | 941 | 39.22% | 1,458 | 60.78% | 0 | 0.00% |
| 1960 | 637 | 30.38% | 1,460 | 69.62% | 0 | 0.00% |
| 1956 | 709 | 40.96% | 1,022 | 59.04% | 0 | 0.00% |
| 1952 | 644 | 34.09% | 1,245 | 65.91% | 0 | 0.00% |
| 1948 | 135 | 12.74% | 849 | 80.09% | 76 | 7.17% |
| 1944 | 266 | 21.70% | 960 | 78.30% | 0 | 0.00% |
| 1940 | 228 | 16.24% | 1,176 | 83.76% | 0 | 0.00% |
| 1936 | 161 | 14.24% | 970 | 85.76% | 0 | 0.00% |
| 1932 | 225 | 14.93% | 1,280 | 84.94% | 2 | 0.13% |
| 1928 | 600 | 49.63% | 609 | 50.37% | 0 | 0.00% |
| 1924 | 295 | 34.58% | 550 | 64.48% | 8 | 0.94% |
| 1920 | 487 | 31.85% | 1,042 | 68.15% | 0 | 0.00% |
| 1916 | 288 | 30.84% | 645 | 69.06% | 1 | 0.11% |
| 1912 | 228 | 24.81% | 647 | 70.40% | 44 | 4.79% |
Education
The county is served by Perquimans County Schools.
Communities
Towns
Unincorporated communities
Townships
- Belvidere
- Bethel
- Hertford
- New Hope
- Parkville
Notable people
- Janice Cole, U.S. Attorney
- Catfish Hunter, professional baseball pitcher for the Kansas City/Oakland A's and New York Yankees
- Wolfman Jack, radio personality
See also
- List of counties in North Carolina
- National Register of Historic Places listings in Perquimans County, North Carolina
References
- ^ "Perquimans County, North Carolina". www.carolana.com. Retrieved August 30, 2022.
- ^ "NC Pronunciation Guide". WRAL. Retrieved August 16, 2023.
- ^ a b c "QuickFacts: Perquimans County, North Carolina". United States Census Bureau. Retrieved March 22, 2024.
- ^ "Find a County". National Association of Counties. Retrieved June 7, 2011.
- ^ "North Carolina: Individual County Chronologies". North Carolina Atlas of Historical County Boundaries. The Newberry Library. 2009. Archived from the original on March 4, 2016. Retrieved January 25, 2015.
- ^ "2020 County Gazetteer Files – North Carolina". United States Census Bureau. August 23, 2022. Retrieved September 9, 2023.
- ^ "U.S. Decennial Census". United States Census Bureau. Retrieved January 18, 2015.
- ^ "Historical Census Browser". University of Virginia Library. Retrieved January 18, 2015.
- ^ Forstall, Richard L., ed. (March 27, 1995). "Population of Counties by Decennial Census: 1900 to 1990". United States Census Bureau. Retrieved January 18, 2015.
- ^ "Census 2000 PHC-T-4. Ranking Tables for Counties: 1990 and 2000" (PDF). United States Census Bureau. April 2, 2001. Archived (PDF) from the original on March 27, 2010. Retrieved January 18, 2015.
- ^ "State & County QuickFacts". United States Census Bureau. Archived from the original on June 7, 2011. Retrieved October 29, 2013.
- ^ "Explore Census Data". data.census.gov. Retrieved December 23, 2021.
- ^ "U.S. Census website". United States Census Bureau. Retrieved January 31, 2008.
- ^ Leip, David. "Dave Leip's Atlas of U.S. Presidential Elections". uselectionatlas.org. Retrieved March 17, 2018.
External links
- Geographic data related to
Perquimans County, North Carolina at
OpenStreetMap
- Official website
- NCGenWeb Perquimans County , genealogy resources for the county
Places adjacent to Perquimans County, North Carolina | ||||||||||||||||
|---|---|---|---|---|---|---|---|---|---|---|---|---|---|---|---|---|
| ||||||||||||||||
Municipalities and communities of
Perquimans County, North Carolina, United States | ||
|---|---|---|
| Towns | | |
|
Unincorporated communities | ||
| International | |
|---|---|
| National | |
| Other | |