
The climate of France is the statistical distribution of conditions in the earth's atmosphere over the national territory, based on the averages and variability of relevant quantities over a given period, the standard reference period defined by the World Meteorological Organization being 30 years. Climate characterization is based on annual and monthly statistical measurements of local atmospheric data: temperature, atmospheric pressure, precipitation, sunshine, humidity, wind speed. Recurrence and exceptional events are also taken into account.
Located between latitudes 41° 19' N and 51° 04'N, metropolitan France is currently in the temperate zone, characterized by warm summers and moderately cold winters. This classification distinguishes between oceanic (cool summers, mild winters, high precipitation), continental (hot summers, cold winters, low precipitation), Mediterranean (hot, dry summers, mild winters, autumn precipitation), mountain (colder and wetter than the surrounding plains) and altered oceanic (a transition zone between oceanic and mountain climates and semi-continental climate). Extreme temperatures recorded in mainland France are 46.0 °C in Vérargues on 28 June 2019 and −36.7 °C in Mouthe on 13 January 1968.
The climates of France's overseas territories are many and varied, depending on their position on the globe, ranging from the cold oceanic type for the subantarctic islands, to the tropical maritime type for the French West Indies, the equatorial type for French Guiana and the polar maritime type for Saint-Pierre-et-Miquelon. French Polynesia, which extends over 20 degrees of latitude, is divided into 5 types.
These climates have varied greatly in the past, with warm periods (optimums) and cold periods (ice ages). Paleoclimates, which date back to geological times, have been marked by alternating ice ages (around 80,000 years) and warm periods (around 20,000 years) at intervals of around 100,000 years. The last Ice Age was a period of global cooling, or glaciation, which marked the end of the Pleistocene on the entire planet. It began 115,000 years ago and ended 11,700 years ago, when the Holocene, the current interglacial period, began. The latter is characterized by the Roman climatic optimum (−300 to +200), the Medieval climatic optimum (900–1300) and the Little Ice Age (1300–1860). The contemporary period (1860 to the present) is marked by the end of the Alpine Little Ice Age (1860-1900-1910), followed by the onset of global warming.
The IPCC's sixth assessment report confirms with certainty the anthropization origin of the global warming already observed. Temperatures in mainland France today are 1.66 °C higher than those measured between 1900 and 1930, with 1.63 °C attributable solely to human activity. Analysis of more precise temperature data between 2010 and 2019 shows that, over this short period, France is warming by 0.1 °C every 3 years. To meet the two objectives of the Paris climate agreement (warming well below 2 °C and preferably limited to 1.5 °C), a sharp and immediate reduction in CO2 emissions is essential, until we reach carbon neutrality, the only way to halt global warming. Reducing emissions of other greenhouse gases, particularly methane, is also relevant. To meet this objective, France, through its climate policy, is deploying various mitigation and adaptation strategies, with specific targets such as reducing greenhouse gas emissions by 40% between 1990 and 2030 (20% in 2019) or reducing final energy consumption by 50% in 2050 compared with the 2012 baseline, with an intermediate target of 20% in 2030.
Notion of climate
The notion of climate has evolved considerably, and it's now easier to define what the "climate system" is, i.e. all the very different components that make up the atmosphere, the oceans, the continental surface, and all their physical, chemical and biological interactions. The word "climate" thus goes beyond the usual strictly atmospheric definition to designate the characteristics of the climate system in a given place, characteristics established over a period, often 30 years, known as the Climate Norm. [1] The parameters used to describe a region's climate are many and varied, from temperature, wind and air humidity to soil water content, river conditions, atmospheric composition and ocean salinity. They are most often analyzed in terms of annual, monthly or seasonal averages. But characterizing climate also means describing rarer and more irregular events, such as violent storms or persistent drought. [2]
France is a transcontinental sovereign state whose metropolitan territory extends across Western Europe, and whose overseas territories stretch across the Indian, Atlantic and Pacific oceans, as well as Antarctica and South America. [3] It is thus characterized by a wide variety of climates, which have also been highly variable over time.
Paleoclimates
Milanković cycles

Life appeared on Earth between 3.8 and 3.5 billion years ago, in the form of the first cells. It was the first living organisms capable of recovering carbon from atmospheric CO2 dissolved in water and progressively enriching the atmosphere with oxygen ( photosynthesis) that set in motion the dynamic cycle of water and climate. The first hominids appeared around 4 million years ago. Ice core records provide a good understanding of the climate over the last million years. It is marked by alternating ice ages (around 80,000 years) and warm periods (around 20,000 years) with a periodicity of around 100,000 years. Since the appearance of man, the average temperature at the Earth's surface has been relatively constant, varying by only a few degrees from an average of around 15 °C. [4]
The regular alternation of warm and cold periods can be explained by astronomy. In 1924, Serbian geophysicist Milutin Milanković demonstrated that three independent parameters characterize the Earth's orbit around the sun and modulate the amount of solar energy according to the seasons: eccentricity, obliquity, the inclination of the Earth's axis of rotation on itself in relation to the plane of rotation around the sun (currently close to 23°) and climatic precession, a term defining variations in the Earth's axis of rotation. Each of these parameters varies over time with independent periods, and their conjunction makes the construction, or disappearance, of icecaps in the Northern Hemisphere more or less favorable, and these icecaps play a decisive role in climate. [4] In France, the South-East basin, considered part of the Alpine domain, stands out from other French geological basins for the very great thickness of its sedimentary layer. Alternating marl and limestone deposits are particularly well exposed in the Vocontian Basin, where Lower Cretaceous formations are mostly in the form of alternating limestone banks and marl interbanks. These alternating sedimentary successions perfectly reflect the interlocking Milanković cycles, providing one of the best proofs of astroclimatic control of sedimentation. [5]
Last Ice Age (−115,000 to −11,700 years ago)
Last Ice Age (−115,000 to −19,000 years ago)
The Last Ice Age is a period of global cooling, or glaciation, that marks the end of the Pleistocene on the entire planet. It began 115,000 years ago and ended 11,700 years ago, when the Holocene began.
Abrupt changes of millennial cyclicity punctuated this last glacial period and had a strong impact on terrestrial and marine ecosystems, as well as on atmospheric composition and temperature. Periods characterized by rising water temperatures in the North Atlantic, Greenland and greenhouse gas concentrations were contemporary with the development of forest in Europe below 50°N, and alternated with cold periods of steppe vegetation. During the changes observed around 40,000 years before present, Neanderthal man disappeared and modern man colonized Europe. [6]
These changes, known as the Dansgaard-Oeschger cycles after their discoverers, have given rise to some forty very rapid climatic pulsations. These phases are associated with variations in North Atlantic surface water temperature and changes in climate on the European continent. These pulses lasted for several millennia, and the transition from a cold episode (stage) to a temperate episode (interstage) seems to have been very rapid, on the order of a few decades, sometimes less! Some of these cold episodes were accompanied by a massive influx of icebergs into the Bay of Biscay from the ice cap covering Canada. These iceberg break-ups, known as Heinrich events, were brutal: each would have lasted on the order of a century, or even a few millennia. Studies of Bay of Biscay sediments have shown that each Heinrich event is synchronous with the rapid development (< 100 years) of a "Central European-type" grass steppe at the expense of pine forest. [7]

The glacial maximum was reached around 21,000 years ago. One of the consequences of this cooling was a marine regression (a general drop in sea level) of around 120 meters at its maximum, [8] and the establishment of a periglacial climate in Europe, North Asia and North America, leading to profound changes in flora and fauna. At the time of this glacial maximum, the Arctic ice cap covered northern Europe, the glaciers of the Alps descended as far as Lyon, and those of the Pyrenees as far as Arudy ( Pyrénées-Atlantiques). Sea level was around 120 m below present, and the shoreline was pushed ~50 km offshore. In southern Aquitaine, deglaciation of the high Pyrenean mountains must have ended around 15,000 years ago. During the last glacial episode, the Landes was a vast sandy expanse dotted with 'fields of small crescent-shaped dunes of metric height. Beyond the Garonne to the east and the Adour to the south, finer particles ( loess) carried by storms to higher altitudes were deposited to form accumulations on the relief, where steppe vegetation then developed. [7]
Tardiglacial (−19,000 to −11,700 years ago)

The Tardiglacial is the period between the Last Glacial Maximum, which ended around 19,000 years ago, and the beginning of the Holocene, 11,700 years ago, during which there was an irregular rise in temperatures, interspersed with relapses. The beginning of the Tardiglacial period in Europe was marked by the disappearance from our latitudes of certain "archaic" animal species ( mammoths, woolly rhinoceroses, cave bears). Reindeer and horses ( Equus caballus gallicus), sometimes combined with Bovinae (bison or aurochs), became the dominant species of the early Interstadial period, judging by the hunting records of human societies. [9]
The Alleröd (13,900 to 12,900 years ago) is characterized by an increase in tree cover. In the Paris Basin and in Belgium, pollen analyses enable us to distinguish two phases in this episode: the first is characterized by the establishment of an open birch forest (afforestation rate of around 45%); the second, which may be separated by a slight retreat in tree cover, sees the expansion of an open pine-dominated forest. Arctic species are partly replaced by woodland species: aurochs and horses – occasionally present – are joined by deer, roe deer, wild boar, elk and beaver. [10]
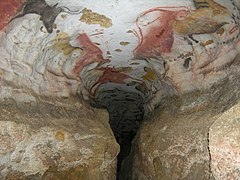
Cave paintings can also provide clues to the climate, but these must be interpreted with care. Plants are rare in cavern art, but the animals depicted can help us to understand the climate outside, even if the species depicted on the cave walls represent only a selection. The compositions do not constitute a photograph of the external landscape. The presence of a saiga antelope on a wall in Rouffignac ( Dordogne) betrays cold, dry steppe conditions. The fact that there is only one reindeer and no mammoth depicted at Lascaux may indicate milder temperatures (or perhaps the artists weren't interested in these animals). [11]
The question is: did the artists reproduce images of animals that actually lived in their territory? As Jean-Loïc Le Quellec points out, elephants can be found sculpted on Romanesque churches, even though this pachyderm did not really frequent our forests. The large bulls in the Rotonde de Lascaux are well known, but certain chronological attributions of the cave mean that its decoration began at a time when aurochs (lovers of wooded environments) were not very present in the immediate environment. According to François Djindjian, mammoths had disappeared from the Périgord by the Middle Magdalenian, and were only found further north, in the Loire and Saône basins and in the Paris Basin. Yet Rouffignac was decorated at this time! He therefore proposes that the artists drew them from memory, having gone to contemplate them in a sort of safari avant la lettre. However, new research indicates that mammoths still existed on the banks of the Vézère at this time. Moreover, as Florian Berrouet points out: "The addition of numerous details indicating seasonality or the extreme naturalistic rigor of the artists (anal flap, eye contour, triangular lower lip) and making each animal unique, endowed with a real personality, forces us to believe that man must have rubbed shoulders with, or even observed, these mammoths for a long time." During colder periods, the big beasts migrated in herds southwards, towards hospitable territories. It is perhaps the memory of such a vision that the Magdalenians of Rouffignac immortalized on stone. [11]
-
 Bulls on the Lascaux rotunda.
 -
 Aurochs in the Lascaux cave. Lascaux 2.
 -
 Mammoth and ibex engraved in the Rouffignac cave.


At the end of the period ( Dryas III), a very severe cold snap led to a return of arctic species, a further retreat of forest and an extension of steppe and tundra landscapes. It ends abruptly with a rapid rise in temperatures. [12] [13]
Climates of the current interglacial period
Temperature changes over the Holocene

The current Holocene interglacial period began some twelve thousand years ago, at the end of the Last Glacial Period (known as the Würm for its Alpine component). [14] In the mountains of Europe, small glaciers also formed in the Vosges, Black Forest, Massif Central, Carpathians, Pyrenees, Apennines, Balkans and Sierra Nevada, as well as in northwest Spain, Crete and Corsica. [15] The deglaciation that preceded it lasted around 10,000 years and resulted in a rise in temperature of around 4 °C and a rise in sea level of around 130 metres. [16]
A study tracing mean annual surface air temperatures across Europe over the last 12,000 years was published in 2003. It is based on quantitative climate reconstructions from over 500 pollen sites assimilated using an innovative four-dimensional gridding procedure. It appears that the Holocene climatic optimum was only observed in northern Europe, and therefore did not affect France. This warming was offset by a mid-Holocene cooling in southern Europe. Trends in mean annual temperatures for the whole of Europe suggest an almost linear increase in the heat budget up to 7800 BC, followed by stable conditions for the rest of the Holocene. This warming at the beginning of the Holocene, followed by an equilibrium, was mainly modulated by rising winter temperatures in the west, which have continued to rise at a progressively decreasing rate to the present day. [17]
Southern Europe and the Mediterranean have experienced almost linear warming since around 8,000 BC. This warming preceded the onset of any major human impact and continued at the same rate until the end of the Holocene, a period of anthropogenic significance. This suggests not only that the Mediterranean climate has an essentially natural origin, but also that the pollen-climate calibration method has remained independent of human impact on vegetation. [17]
The study divides Europe into six parts, delimited in latitude by the 45°N and 55°N parallels and in longitude by the 15°E meridian. France, crossed by the 45°N parallel ( Bordeaux latitude), is represented by two parts: the part north of 45°N is in Central-Western Europe, and the part to the south is in Southwestern Europe. The graphs representing temperature variations in mainland France over the Holocene, reconstructed from pollen data, are shown below [17].


Climatic and cultural sequences throughout the Holocene
In southern France (below latitude 45°N), the climate changed around 8,000 BC. From this date onwards, we can distinguish a phase known as Boreo-Atlantic, which ends with a cold episode, which appears to be worldwide, centered on 6,250 BC. This phase seems to have been marked by a relatively uncertain climate, or at least one of great contrasts. Then, for around half a millennium, we witness the return of an Atlantic ensemble – towards which the sequence preceding this episode was already tending. This is defined by high, very regular rainfall from Spain and North Africa to the Balkans. In addition, average temperatures (and particularly average summer temperatures, the most favorable for vegetation) are said to have been 1.5° to 2 °C higher than in the 1970–1980 period. They may even have exceeded them by 2° to 2.5 °C during what are known as climatic optimum sequences (the first of which occurred around 5700 BC). [18]
Comparing these major climatic sequences with the major cultural sequences may reveal a link between certain sequences. The following table shows such a timeline for Haute-Provence. While the cultural sequences are identical throughout France, the years separating them vary from region to region. This is particularly true of the Neolithic period, when the first groups settled in Provence, Languedoc and Corsica around 5500 BC, but only reached certain other parts of France several hundred years later. [19] [18]
| Major climatic sequences | Great cultural sequences in inland Provence | ||
|---|---|---|---|
| Beginning of our era | Cold, wet sequence (Göschenen I), few thunderstorms but heavy precipitation (including snow at high altitudes) | 750 BC | Iron Age |
| 850 BC | Fairly dry, cool sequence violent thunderstorms, frequent until around 1050/1000 | Bronze Age | |
| 1250 BC | Cold, wet spell (Lobben) – few thunderstorms | ||
| 1450 BC | Fairly dry cool spell, occasionally very violent thunderstorms | ||
| 1850 BC | Very cool and humid sequence frequent violent thunderstorms (Southern Pre-Alps) | 1800 BC
2350 BC |
Chalcolithic |
| 2550 BC | Sub-boreal sequence: gradual drying | Neolithic final | |
| 3200 BC | Cool sequence, severe thunderstorms likely | 3400 BC
3700 BC 4700 BC |
Late Neolithic |
| 3600 BC | Atlantic sequence temperatures warmer than present (1.5 °C-2 °C) climatic optimum around 4900 (2 to 2.5 °C warmer than present. regular, non-violent rainfall). | Middle Neolithic | |
| 5200 BC | Cooler or colder sequence | 5400 BC
6600 BC 8000 BC 9500 BC |
Early Neolithic |
| 5500 BC | Atlantic sequence
climatic optimum around 5700 (2 °C-2.5 °C higher than present, regular and mild precipitation) |
Late Mesolithic | |
| 6100 BC | Cooler, drier period with thunderstorms | Middle Mesolithic | |
| 6300 BC | Boreo-Atlantic sequence
progression of temperatures and precipitation (at least 8000-7000) tending towards an Atlantic character warmer than the present (1.5 °C-2 °CC) with regubliere precipitation, but persistence at least during certain phases of powerful thunderstorms (major fires). |
Middle Mesolithic | |
| 8000 BC | Pre-Boreal
very rapid rise in temperatures at the start (second Great Warming), followed by gradual coolness relatively dry, but periods of heavy rain in some regions (Southern Pre-Alps), perhaps partly of a stormy nature |
Azilian | |
| 9600 BC | Recent Dryas
cold and dry sometimes and very heavy rainfall | ||
Roman climatic optimum (−300 to +200)
The rise of the Roman Empire and viticulture in Gaul

The period between 300 B.C. and A.D. 200 witnessed the development and rise to power of the Roman Empire. This prosperous period is considered socially stable. It corresponds precisely to the period of the Roman Climatic Optimum (RCO), when summers are warm and rather humid. These climatic conditions favored the development of agriculture, as well as the establishment of ornamental gardens. This situation is linked to greater solar activity, linked to the activity of ocean currents, and low volcanic activity. The OCR would therefore have been particularly beneficial to the strong development of viticulture, which expanded in the three Gauls during the 1st. century, reaching as far as southern England. Generally speaking, since agriculture was the Roman Empire's primary source of wealth, it is now clearer that this climatic change was a powerful driving force behind economic development until the 1st. century. [20]
Lyon's development in flood zones
The settlement and development of the city of Lyon in a flood zone benefited from a favorable climatic context linked to the Little Roman Optimum, corresponding to a period of moderate hydrology. A reconstruction of the hydrosedimentary variability of the Rhône at Lyon from 1000 BC to 2000 AD shows the approximate fluctuation of solid and liquid flows over the period. In particular, these curves describe an oscillation during the period between the end of the 1st century BC and the 1st century AD. This was a short period of climatic oscillation, with several episodes of flooding characterized by greater intensity and frequency than in earlier and later periods. The main floods have been dated to the reigns of Augustus, Tiberius and Claudius, between 27 BC and 54 AD. Another climatic oscillation can be seen in the early Middle Ages [21]
This ancient hydrosedimentary crisis within the Roman Petit Optimum can be identified in other areas of Gallia Narbonensis. For example, during the same period, the Saint-Ferréol branch of the Rhône, in the delta, continued to advance. Elsewhere, the port of Narbonne (Narbo Martius) experienced accelerated silting in the 1st century. In Lyon, archaeological digs have shown that the urban society of the city's riverside adapted to this crisis through a series of developments designed to occupy the peninsula between the Rhône and Saône rivers. [21]
Late Antiquity: climatic disasters and the fall of the Roman Empire
The impact of climatic degradation during Late antiquity on the end of the Roman Empire in the West has long been widely discussed in scientific literature. It has been seen as the cause of the great barbarian invasions, of a drop in cereal yields causing famine, of a change in land use, with a conversion of arable land to pasture in Western Europe, and so on. It has also been suggested that the development of rye cultivation in Gaul in late Antiquity was an adaptation of agriculture to the colder climate, which would be an example of resilience. This period of climatic change would thus have affected agricultural production and played a role in historical upheavals, in particular the fall of the Western Roman Empire. But climate was certainly not the sole cause of the fall of the Roman Empire. By the end of the Empire, Roman society was certainly more vulnerable or more exposed to environmental conditions. North American historian Kyle Harper insists on the role of pandemics in the Empire's weakening, due in particular to several periods of plague. [22]
Medieval climatic optimum (900–1300)
The medieval Little Optimum Period (POM) took place in Western Europe between 900 and 1250–1300 AD, with seasons that were slightly milder or warmer, and perhaps drier, than those of the following period. The Little Medieval Optimum may have seen average temperatures of 0.5 °C higher than those of the Little Ice Age that followed, which was itself 0.7 to 0.8 °C lower than those of the end of the 20th century. [23]
Climate zones in mainland France
Worldwide classifications
Latitudinal distribution
Climatologists have drawn up a number of classifications to reflect the diversity of situations on the planet. Overall, they delineate three main zones according to latitude (cold, temperate and hot climates). France is in the temperate zone, characterized by hot summers and moderately cold winters. This classification distinguishes between oceanic (cool summers, mild winters, high precipitation), continental (hot summers, cold winters, low precipitation) and Mediterranean (hot, dry summers, mild winters, autumn precipitation) climates. Within these three climatic zones, a variety of nuances emerge, depending on parameters such as altitude (mountain climate, colder and wetter than in the surrounding plains). [24]
Köppen classification
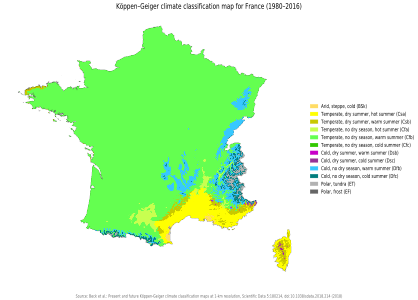
The Köppen classification is a climate classification based on precipitation and temperature. It was invented in the 1920s by botanist Wladimir Peter Köppen, who combined the world vegetation map published in 1866 by Hermann Griesbach and the division of climate into five zones by de Candolle. [25] A climate is thus identified by a two- or three-letter code. This is the most common climatic classification, in the version presented by Rudolf Geiger in 1961. The Köppen-Geiger map remains a reference today, thanks to its frequent updates, in the fields of hydrology, geography, agriculture, biology and climatology through its research into the evolution of climates.
A large part of mainland France lies in the oceanic domain (Cfb), while the plains and hills bordering the Mediterranean basin have a climate designated by Csa.
Eco-climatic classifications
Les paramètres climatiques permettent de prévoir le type de végétation dans une zone, de la même manière l'examen d'une flore permet d'en déduire le climat. Le PNUD et le WWF usent ces critères bioclimatiques pour définir des écozones. Ce type de classification décrit des biomes et non-pas strictement des climats, le climat se déduisant du biome. En vert, les forêts tempérées décidues et mixtes; en marron, les Forêts, terres boisées et broussailles méditerranéennes
-
 Köppen-Geiger classification of France based on 1980-2016 data.
 -
 WWF classification, differentiating 14 terrestrial biomes (two for France).


National typologies
8 types of climate (Joly et al. – 2010)
A 2010 study by Daniel Joly, Thierry Brossard, Hervé Cardot, Jean Cavailhes, Mohamed Hilal and Pierre Wavresky classified metropolitan France's climates into eight major types. Based on station measurements of precipitation and temperature provided by Météo-France, a set of 14 variables incorporating a 30-year time series (1971–2000) was defined to characterize climates and their distinctive modes of variation. An original method known as local interpolation was used to reconstitute the continuous spatial fields of the variables in question, and to express them in the form of information layers manageable by GIS. The result is 8 types of climate [26]

- Type 1 (blue): mountain climates include all areas where mountain and/or semi-continental influences predominate, with a high number of days and a high accumulation of precipitation, an average temperature below 9.4 °C and, correlatively, more than 25 days with a minimum temperature below −5 °C and fewer than 4 with a maximum above 30 °C. [27]
- Type 2 (light-blue): semi-continental climate and climate of the mountain margins include the mountain peripheries and extend over vast areas where temperatures are less cold than in the mountains (although, at equal altitude, they are colder than anywhere else), precipitation is slightly lower and less frequent, but climatic variability over the 1971–2000 normal is just as high. [28]
- Type 3 (turquoise): The degraded oceanic climate of the central and northern plains remains oceanic, but with some fine gradations. Temperatures are intermediate (around 11 °C annual average, between 8 and 14 days with temperatures below −5 °C). Precipitation is low (less than 700 mm annual total), especially in summer, but rainfall averages 12 days in January and 8 in July, which are average values for France as a whole. [29]
- Type 4 (pale green): The altered oceanic climate represents a transition between the frank oceanic (type 5) and the degraded oceanic (type 3). The average annual temperature is fairly high (12.5 °C), with a low number of cold days (between 4 and 8 per year) and a high number of hot days (between 15 and 23 per year). The annual temperature range (July–January) is close to the minimum, and interannual variability is average. Precipitation, average yearly (800–900 mm), falls mainly in winter, while summer is fairly dry. [30]
- Type 5 (dark green): Oceanic climate. Temperatures are average and very homothermic: annual amplitude (less than 13 °C difference between July and January), number of cold days (less than 4) and hot days (less than 4) and interannual variability are minimal. Precipitation is abundant every year (just over 1,000 mm) and frequent in winter (over 13 days in January). Summer is also rainy (8–9 days in July), but rainfall totals are low. [31]
- Type 6 (vivid green): Altered Mediterranean climate. The average annual temperature is high, with a small number of cold days and hot days ranging from 15 to 23/year. Interannual variability in July temperatures is minimal: summer is repeatedly hot from one year to the next. Annual precipitation is average (800–950 mm), but not evenly distributed. [32]
- Type 7 (orange): The climate of the Southwest Basin is characterized by high mean annual temperatures (above 13 °C) and a high number (> 23) of warm days, while days with frost below −5 °C are rare. The annual thermal amplitude is high (15 to 16 °C) and the interannual variability of winter and summer temperatures is low. Precipitation, which is not very abundant (less than 800 mm) in winter, is slightly more abundant in summer. It is more frequent in winter (9-11 days) than in summer (less than 6 days). [33]
- Type 8 (yellow): The frank Mediterranean climate. The climatic characteristics are very clear-cut, more so than in any of the previous seven climates. Annual temperatures are high, with rare cold days and frequent hot days. The inter-annual amplitude is high (over 17 °C between July and January), while these characteristics are very stable from one year to the next. The very high ratio of autumn to summer precipitation (> 6) is the main characteristic of this climate. Cumulative annual precipitation is low, with an arid summer but a fairly well-watered winter despite a low number of rainy days. [34]
5 types of climate (Météo-France – 2022)
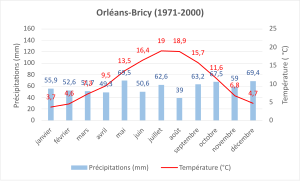
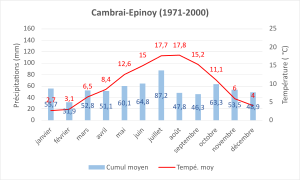
Climate characterization has also been the subject of various types of representation, notably umbrothermal diagrams (climatograms, climograms or climate maps). These graphical representations show precipitation and temperature for each month of the year. The etymology of the word ombrothermique is in fact linked to the Greek ombros (storm rain) and thermique (relating to heat, temperature). The temperatures and precipitation used in these diagrams correspond to average monthly data for a given location, recorded over thirty years. This type of visual representation makes it possible to compare the temperature and precipitation of different climates in relation to each other. For example, the French territory is made up of several climates: oceanic (Brest), altered oceanic (Cambrai), semi-continental (Lons-le-Saunier), Mediterranean (Marseille) and mountain (Chamonix Mont-Blanc). [24]
The map of these five major climate types in mainland France published by Météo-France in 2022, together with the characterization of these climates and the representative umbrothermal diagrams, are as follows [35]
- Type 1. The oceanic climate is characterized by mild temperatures and relatively abundant rainfall (due to disturbances from the Atlantic), distributed throughout the year, with a slight maximum from October to February. The city of Brest is representative of this climate. [36] [37] [38]
-
 Climate normals 1971-2000
 -
 Climate normal 1981-2010
 -
 Climate normals 1991-2020


- Type 2. The altered oceanic climate is a transition zone between the oceanic climate and the mountain and semi-continental climates. Temperature differences between winter and summer increase with distance from the sea. Rainfall is lower than at the seaside, except in the vicinity of relief. The towns of Orléans [39] [40] [41] and Cambrai are typical of this climate. [42] [43] [44]
-
 Climate normals 1971-2020
 -
 Climate normal 1981-2020
 -
 Climate normals 1991-2020


-
 Climate normals 1971-2020
 -
 Climate normal 1981-2020
 -
 Climate normals 1991-2020


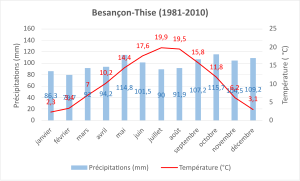
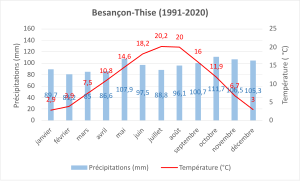
Type 3. Semi-continental climate. Summers are hot and winters harsh, with many days of snow or frost. Annual rainfall is relatively high, except in Alsace, which benefits from the protective effect of the Vosges mountains (föhn effect). Rainfall is heaviest in summer, often with thunderstorms. The city of Besançon is representative of this climate [45] [46] [47]
-
 Climate normals 1971-2000
 -
 Climate normal 1981-2010
 -
Climate normals 1991-2020


Type 4. Mountain climate. Temperature decreases rapidly with altitude. There is minimal cloud cover in winter and maximum in summer. Winds and precipitation vary considerably according to location. The town of Bourg-Saint-Maurice (altitude: 865 m) is representative of this climate. [48] [49] [50]
-
 Climate normals 1971-2000
 -
 Climate normal 1981-2010
 -
 Climate normals 1991-2020


Type 5. The Mediterranean climate is characterized by mild winters and hot summers, plenty of sunshine and frequent strong winds. There are few rainy days, irregularly distributed over the year. Dry winters and summers are followed by very wet springs and autumns, often in the form of thunderstorms (40% of the annual total in 3 months). In just a few hours, this precipitation can bring 4 times more water than the monthly average to a given location, particularly near the relief (Mediterranean episode). The city of Marseille is representative of this climate.
[51]
[52]
[53]
-
 Climate normal 1971-2020
 -
 Climate normal 1981-2020
 -
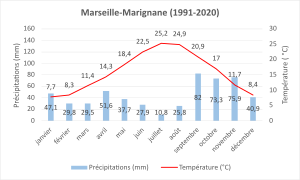 Climate normals 1991-2020


29 climate regions (Météo-France – 2020)
In 2020, Météo-France is also publishing a map showing a breakdown into 29 climatic regions, taking into account the many factors that can influence climate on a regional scale, such as latitude, altitude, distance from the sea or major mountain ranges, etc. [54]

|
Microclimates
Overseas France
Overseas France, with its widely scattered territories, has a wide variety of climates.
Saint-Pierre and Miquelon
Saint-Pierre and Miquelon has a cold, humid oceanic climate. According to Köppen's classification, Saint-Pierre and Miquelon is in category Dfb ( humid continental climate) / Dfc ( subarctic climate with no dry season).
To the east of the large North American continental landmass, the climate is strongly influenced by it. Prevailing westerly quadrant winds originating on the continent come into contact with the ocean, often resulting in significant temperature contrasts. In winter, these winds are very cold and come into contact with milder oceanic air masses, creating or activating vigorous disturbances that generate intense snowfalls and sharp temperature drops. In summer, the flow is slightly different: warm and sometimes humid continental air masses from the Gulf of Mexico, upwelling via the American continent, come into contact with cold ocean waters (cold polar downwelling, also known as the " Labrador Current"), often resulting in thick, tenacious fog. The air is stabilized by the cold water, and rainfall is lower at this time of year.
This is a semi-continental climate, with fairly cold winters (average February temperature of −3.5 °C in Saint Pierre), though milder than on the American mainland, and very cool summers (15.5 °C in Saint Pierre in August, cooler than in mainland France at the same latitude) due to the presence of cold oceanic water. At the heart of this clash of air masses with very different characteristics, rainfall is abundant (1,312 mm per year in Saint-Pierre), with a winter maximum.
French West Indies (Guadeloupe, Saint-Martin, Saint-Barthélemy, Martinique), Reunion Island, Indian Ocean islands (Îles Éparses), Mayotte, New Caledonia, French Polynesia, Wallis and Futuna.
These islands, whose latitude extends a little beyond the Tropics (Rapa 27° 37′ S) and less than ten degrees towards the equator (Hiva-Oa 9° 49′ S), are located in the flow of the trade winds that blow regularly at these latitudes. These disturbances are moderate during the dry season, which corresponds to the winter at higher latitudes, and much more frequent and abundant during the summer and especially autumn periods of the year, as a result of the higher ocean temperatures at this time and the growing instability due to the proximity of the ITCZ (Inter-Tropical Convergence Zone), which rises in latitude in the summer hemisphere. There is a clear contrast between the "windward" slope exposed to the trade winds, which receives between 1,500 and 2,500 mm of rain annually (up to 4,634 mm annually at Plaine des Palmistes in La Réunion, at an altitude of 1,032 m), and the "leeward" slope (980 mm annually at Koumac in New Caledonia), which is much drier and even arid in places. The months with the least rainfall have between 30 and 90 mm (the dry season is relative), while the months with the most rainfall have between 200 and 400 mm.
In addition to the upsurge in rainfall in late summer/autumn, these islands are exposed to devastating tropical cyclones at this time of year, both in terms of the amount of rain dumped in a few hours and the stormy winds associated with them.
Due to the oceanic environment and low latitude, annual averages are high (Ile des Pins 22.5 °C, Saint Denis 24 °C, Le Lamentin 26.2 °C) and temperature differences are not very marked in these regions. Differences from one day to the next and from one season to the next are not very marked. The annual amplitude increases slightly as you move away from the equator, ranging from 1.9 °C in Hiva-Oa to 6.3 °C in Rapa, further away from the equator, via 3.1 °C in Pointe à Pitre. Differences between seasons are much more due to differences in rainfall than to differences in temperature.
Unlike temperate zones, the mountains in these regions have a higher annual amplitude than low-lying areas.
These islands have a tropical climate.
French Guiana
French Guiana has a humid equatorial climate. Close to the equator, French Guiana is characterized by high temperatures all year round (annual average 26.3 °C in Cayenne and 26.5 °C in Saint-Laurent), with very little difference from one month to the next (less than 2 °C difference between the warmest and warmest months in Cayenne and Saint-Laurent), and very abundant rainfall (3,674 mm per year in Cayenne, 2,595 mm per year in Saint-Laurent) spread over almost every month of the year. In Cayenne, only the months of September and October have less than 150 mm of rainfall (75 and 80 mm respectively), and some months have rainfall close to 500 mm (May or June). In Saint-Laurent, with its more uniform rainfall pattern, all months have more than 100 mm, with September and October being the least rainy and the only two months with less than 150 mm, and the wettest months totalling around 400 mm. Permanently bathed in equatorial air, with little seasonal variation, the temperature records are only slightly accentuated: 17.5 °C and 36.4 °C in Saint-Laurent. Close to the equator, French Guiana is not visited by cyclones.
Saint-Paul and New Amsterdam
The latitude of these islands means they are permanently swept by the intense westerly flow of the southern hemisphere. However, being relatively far from the pole (between 37° S and 39° S), their climate is not too cold, with an annual average of 14.1 °C in New Amsterdam. Bathed by an immense ocean, whose waters are stirred up by disturbances, these regions experience a fairly small amplitude between winter and summer. The climate is windy, with a temperate summer (average February temperature of 17.6 °C at Saint-Martin-de-Viviès in New Amsterdam) for the latitude, and a mild winter (average August temperature of 11.5 °C at New Amsterdam). Frost is unknown.
These islands are affected by regular, vigorous storms, and enjoy abundant rainfall (around 1,100 mm/year) throughout the year, with a marked increase in autumn and early winter (April to August). Summer (November to March) is calmer and less rainy as the tropical anticyclone moves up in latitude. The extremes are 72 mm in February and 119 mm in June.
Crozet and Kerguelen
These islands, like the previous ones, are permanently swept by the intense circumpolar westerly flow in the immense southern hemisphere ocean. However, closer to the pole, their climate is even windier and much colder. Well supplied with polar air by the very cold Antarctic continent, disturbances are vigorous and frequent, windy and with little respite from one season to the next, generating rainfall evenly distributed throughout the year, moderately abundant at Port-aux-Français (800 mm/year) in a sheltered position on the east coast, much more intense on the west coast.
Because the environment is even more turbulent than in the previous area, the temperature range between winter and summer is very small for the latitude, around 6 °C (between 8 and 45 °C in the northern hemisphere at the same latitudes). Apart from the wind, winter is relatively mild, with an average temperature of 2.2 °C in August in Port-aux-Français, while summer is very cool, with an average of 8.3 °C in February in Port-aux-Français, already polar despite the latitude (between 46° S and 49° S). It can freeze almost every month on Kerguelen and 10 months out of 12 on Crozet, but records (cold or hot) are not very marked (absolute extremes −8.6 °C and 25.8 °C on Port-aux-Français).
Adélie Land
A narrow sector of the enormous Antarctic ice mass, Adélie Land has an extreme polar climate, within the coldest continent on earth, with a very low average winter temperature (−16.5 °C in July at Dumont d'Urville, which is relatively cooler because it's by the sea, but can approach −70 °C in the heart of the continent) and a consistently negative average summer temperature, even along the coast (−0.8 °C in January at Dumont d'Urville, but around −20/-30 °C inland). In winter, intense cooling is caused by permanent night-time conditions over a continental mass centered on the pole and relatively isolated from thaw by the vigorous westerly flow that prevails in the southern hemisphere's mid-latitudes. In summer, the permanent sunshine is unable to warm these regions, due to the thermal inertia of the enormous glacial mass, the persistent snow cover with its high albedo, and the cold ocean mass surrounding the continent.
This is the domain of the very violent katabatic wind that blows from the interior of the continent towards the coast, caused by the descent of the icy air that forms on the summit of the Antarctic Plateau (over 3,000 m) towards sea level. Through adiabatic compression, however, this air "warms up" considerably during this journey, reaching the ocean much less cold than it was in the interior of the continent (record cold of −37 °C at Dumont d'Urville, which is "mild" compared with the −90 °C sometimes reached in winter in the heart of Antarctica).
The wind is also caused by disturbances circulating around the edge of the continent.
Precipitation, although not measured, is estimated to be fairly low in this permanently icy environment, as the cold is not conducive to it.
Climate parameters
Observation and data collection systems
Contemporary classifications are based on objective measurements of measurable parameters at the origin of climate: temperature, humidity, hydrometry, rainfall, sunshine, wind speed, etc.; and on statistical analysis. Indices derived from these measurements can be created, such as the aridity index and evapotranspiration. These objective measurements are supplemented by more empirical assessments, such as Köppen's classification, designed to match climatic zones with biomes.
Observation systems were set up as early as the Age of Enlightenment, on the initiative of learned societies. Systematic operational practice followed in the 19th century, with the creation of meteorological services in several countries. In 1854, the maritime disaster in the Crimea led to the creation of observation and warning services in France and Great Britain. In 1856, 24 measuring points manned by employees of the telegraph administration were in operation in France: they formed the telegraphic meteorological network of the Paris Observatory, which began publishing its International Bulletin [55] daily in November 1857. In 2014, France was covered by a dense network of more than 5,500 weather stations, with an average of 1 station every 11 km, recording actual field observations of climatic parameters such as temperature, precipitation, wind and humidity. These data are generally controlled and validated to limit bias. [56]
Climate models
Climate models play a key role in estimating past and future climate variations. They rely on the laws of fluid mechanics to numerically reconstruct the main features of atmospheric and/or ocean dynamics. The first global atmospheric models were developed using a grid resolution of around 500 kilometers, and by the 1970s it was already possible to describe the main features of atmospheric circulation using numerical. [57] Climate models differ from one another in terms of their objectives, their resolution, the temporality of the spatialized data and the climate data provided.
Aurelhy model (Météo-France)
The Aurelhy (Analyse Utilisant le RELief pour l'HYdrométéorologie) model, developed by Météo-France, provides 30-year normals (1951–1980; 1961–1990; 1971–2000; 1981–2010; 1991–2020) and annual statistics for temperature and precipitation parameters. When the Aurelhy normals for the 1981–2010 period were updated, an important development was the use of a new digital terrain model and better consideration of the quality of measurement stations. The 1991–2020 normals were published in June 2022. [58] Mesh resolution is one kilometer. [57] [59]
ETPQ model (Météo-France)
The ETPQ (Daily Potential Evapotranspiration) model was built to meet the need for real-time monitoring of potential evapotranspiration over the whole country by users in the agronomy sector. Six climatic parameters are used, including global radiation, temperature, humidity and wind speed. The grid resolution is twelve kilometers. [57]
Safran model (Météo-France)
The Safran model (Système d'Analyse Fournissant des Renseignements Atmosphériques à la Neige) is an analysis of atmospheric data (by analysis we mean an estimate of recent or present conditions, depending on the time step considered) built during the 1990s by Météo-France. At the time, its aim was to forecast avalanche risk in mountain areas (hence its name) by providing data on an hourly time step. The model is based on a division of the French national territory into 615 climatically homogeneous regions. These regions are irregular in shape, and normally cover an area of less than 1,000 km2. In each homogeneous region, Safran then estimates the variation in 8 climatic parameters by 300 m altitude class, based on all available climate data (weather stations, but also analyses of large-scale weather forecasting models such as Météo-France's ARPEGE model). The mesh resolution is eight kilometers. [57]
Digitalis model (AgroParisTech)
The Digitalis model, developed by AgroParisTech in Nancy, involves modeling the climatic parameters required to calculate the water balance: solar radiation, average temperatures at the top of the forest canopy, precipitation and evapotranspiration according to Turc's formula. Evapotranspiration and temperature are spatialized at 50 m intervals, based on the IGN digital terrain model (DTM), and therefore take into account the topo climate at a resolution level fin [57]
Arpège model (CNRM-CE)
The ARPEGE-Climat model, developed in the 1990s, is the climate version of the ARPEGE numerical model, a global and spectral general circulation model developed by the Centre national de recherches météorologiques in collaboration with the European Centre for Medium-Range Weather Forecasts (ECMWF). The ARPEGE grid can be tilted to change the pole position and stretched to increase resolution in an area of interest, enabling regional studies to be developed. [60] [61] The operational short-range ensemble forecasting system, known as PEARP (Prévision d'Ensemble ARPege), is also based on the Arpège model. This system aims to capture and quantify the uncertainty inherent in any weather forecast. Its horizontal resolution is around 7.5 km over France, and 36 km in the antipodes. [62]
Arome model (Météo-France)
The AROME model, operational since 2008, is the fine-mesh numerical weather prediction model used operationally by Météo-France to improve short-term forecasting of dangerous phenomena such as heavy Mediterranean rainfall (Cévennes episodes), violent thunderstorms, fog or urban heat islands during heatwaves. [63]
Other models (IPSL)
The Institut Pierre-Simon Laplace (IPSL) is a federation of research laboratories dedicated to the study of the climate system and the global environment. Since 1995, the IPSL Climate Modeling Center (IPSL-CMC) has been developing and using climate models to improve our understanding and knowledge of the climate system, its current characteristics and its past and future changes. IPSL's Earth System Model (ESM) represents the various components of the climate system and their interactions. It includes the LMDz model for the atmosphere, the INCA and REPROBUS models for atmospheric composition, the NEMO model for the ocean, including ocean dynamics (NEMO-OCE), sea ice (NEMO-LIM) and ocean biogeochemistry (NEMO-PISCES), and the ORCHIDEE model for land surfaces. A new dynamical core for the atmosphere, known as DYNAMICO, is now coupled to atmospheric physics and constitutes a new-generation model. [64] The Laboratoire de météorologie dynamique (LMD), set up in 1968, is one of the laboratories working on these models and on models of its own, notably the LMDZ, an atmospheric general circulation model developed since the 1970s. [65]
Temperatures
Climate normals, calculated over 30 years, are used to characterize the climate at a given location, for a given period. Normals are calculated for all climate variables (temperature, precipitation, wind, sunshine, etc.), as well as for numerous indicators illustrating the statistical distribution of these parameters: average, quintiles (what happens one year in five), records, number of days above a threshold, etc. [66]
Average temperature
| Year | Anual
Average |
January | February | March | April | May | June | July | August | September | October | November | Decemember |
|---|---|---|---|---|---|---|---|---|---|---|---|---|---|
| 2024 | 6.1 | ||||||||||||
| 2023 | 14.4 | 6.3 | 6.9 | 10.2 | 11.8 | 16.2 | 21.5 | 21.9 | 22.0 | 21.1 | 16.4 | 10.1 | 8.0 |
| 2022 | 14.5 | 5.0 | 8.1 | 9.9 | 11.8 | 17.8 | 21.2 | 23.2 | 23.7 | 18.2 | 17.2 | 10.9 | 6.7 |
| 2021 | 12.9 | 4.9 | 8.2 | 8.9 | 10.4 | 13.8 | 20.3 | 20.7 | 20.0 | 19.3 | 13.5 | 77.9 | 6.9 |
| 2020 | 14.1 | 7.1 | 9.3 | 9.4 | 14.1 | 16.5 | 18.6 | 21.6 | 22.6 | 19.0 | 13.0 | 10.5 | 6.9 |
| 2019 | 13.7 | 4.6 | 8.0 | 10.1 | 11.7 | 13.9 | 20.1 | 23.0 | 21.8 | 18.5 | 15.1 | 8.8 | 8.1 |
| 2018 | 13.9 | 8.4 | 3.5 | 8.2 | 13.8 | 16.3 | 20.1 | 23.2 | 22.3 | 19.0 | 14.4 | 9.6 | 7.7 |
| 2017 | 13.4 | 3.1 | 8.2 | 11.0 | 11.4 | 16.5 | 21.2 | 21.7 | 21.5 | 16.4 | 14.9 | 8.2 | 5.9 |
| 2016 | 13.1 | 7.1 | 7.3 | 8.0 | 11.1 | 15.0 | 18.7 | 21.3 | 21.5 | 19.7 | 12.6 | 8.8 | 5.6 |
| 2015 | 13.6 | 5.6 | 4.9 | 9.1 | 12.6 | 15.5 | 19.8 | 22.8 | 21.6 | 16.4 | 12.7 | 11.2 | 9.5 |
| 2014 | 13.8 | 7.6 | 7.9 | 9.8 | 13.0 | 14.7 | 19.6 | 20.6 | 19.1 | 18.9 | 15.9 | 11.3 | 6.3 |
↓ Climate normals (°C) ↓
| |||||||||||||
| 1991–2020 | 13.0 | 5.4 | 6.1 | 9.1 | 11.8 | 15.4 | 18.9 | 21.1 | 21.1 | 17.5 | 13.1 | 9.0 | 6.1 |
| 1981–2010 | 12.6 | 5.0 | 5.7 | 8.7 | 11.1 | 15.0 | 18.3 | 20.8 | 20.6 | 17.3 | 13.5 | 8.5 | 5.6 |
| 1971–2000 | 12.2 | ||||||||||||
| 1961–1990 | 11.8 | ||||||||||||
| 1951–1980 | 11.6 | ||||||||||||
Metropolitan France
.png)
Temperatures in mainland France are on the rise. Warming is between +0.19 °C and +0.40 °C per decade for the minimum temperature (Tn) and between +0.22 °C and +0.45 °C per decade for the maximum temperature (Tx) for metropolitan France. These trends are all statistically significant, and are associated with an uncertainty of around ±0.1 °C per decade. On average, over all available series, warming is +0.29 °C per decade for Tn and +0.32 °C per decade for Tx. However, this difference in trend between Tn and Tx (0.03 °C) is not significant. [67]
Average temperature (Tm) is defined as the average of minimum and maximum temperatures. Tm series show significant trends, ranging from +0.21 °C to +0.39 °C per decade. Consistent with Tn and Tx, the average trend is +0.31 °C per decade, and there are no significant spatial contrasts between the different regions. [67]
The map on the right shows the 1981–2010 temperature normals spatialized on a grid of kilometric resolution. [68]
Overseas
A similar trend can be observed in the French overseas departments. In French Guiana, for example, the increase is in the order of 0.24 degrees per decade over the period 1955–2009. Warming has accelerated in recent decades. The increase in mean annual temperature reached 0.34 degrees per decade over the period 1979–2005. In Martinique, the increase was around 0.28 degrees per decade over the period 1965–2009. Warming reached 0.33 degrees per decade over the period 1979–2005. [67]
Precipitation
Annual characteristics
Average annual precipitation totals for mainland France have been relatively stable since the 1970s (932 mm for 1971–2000, 935 mm for 1981–2010, 935 mm for 1991–2020). However, this observation masks major seasonal and regional disparities, as follows Meteo France, Sénat:
- In winter, there was a slight increase in rainfall in the northern half of the country, and a marked drop in the southern half.
- in spring, rainfall fell sharply in the south-eastern quarter of the country, but rose sharply elsewhere (particularly in the north-eastern quarter).
- in summer, there is a slight increase in rainfall over much of the northern half of the country, and a drop in the southern half, which is particularly marked around the Mediterranean.
- in autumn, there is a clear increase in precipitation in the Massif Central and the East, and a slight drop elsewhere, with a more pronounced fall around the Mediterranean.
The range of average annual precipitation is very broad, from less than 600 mm in the eastern half of the Eure-et-Loir, the Rhône delta and the Aude valley, to over 2000 mm in the Cantal mountains, Mount Aigoual and the Chartreuse. Precipitation remained below 800 mm throughout the Paris Basin. [69]
Heavy rain in mainland France
The regions of France most exposed to torrential downpours that can bring more than 200 mm (and in some cases considerably more) in a single day are those bordering the Mediterranean. In some cases, these amounts are recorded in just a few hours. The departments of Ardèche, Gard and Hérault are the most exposed to torrential downpours. In 50 years, there have been more than 50 occurrences of more than 200 mm in 1 day at at least one measuring point in the department. In other words, this type of rainfall occurs on average at least once a year. Among the most remarkable "Cevennes" episodes in south-eastern France, those recording more than 200 mm per day for 2 consecutive days occurred on 17 and 18 December 1997, 11 and 12 November 1996, 3 and 4 November 1994, 7 and 8 November 1982, 31 October and November1, 1968, 24 and 25 September 1965, and 30 and 31 October 1963. [70] These extreme daily rains are becoming increasingly intense around the Mediterranean. They are also characterized by great variability from one year to the next. [67]
Climatic parameters for 30 cities
The table below shows the main climatic parameters for the period 1991–2020 for the 30 stations used to calculate the national heat indicator. [71]
| Stations | Temperatures | Sunshine | Precipitation | |||||
|---|---|---|---|---|---|---|---|---|
| average | average max | extreme mini | Cumulative
average |
Max
in 24 h |
Max
in 5 d |
Avg > 1 mm | ||
| Agen [72] | 13.8 | 41.0 (1 August 1947) | −211.9 (15 February 1956) | 2019.9 | 708.2 | 198.9 (Nov 9th,1968) | 223.3 (Nov) | 6.1 |
| Bastia [73] | 16.3 | 38.3 (20 August 1988) | −5.0 (16 February 1956) | 2645 | 816.9 | 511.0 (16 July 1993) | 511.0 (July) | 10.8 |
| Besançon [74] | 11.4 | 40.3 (28 July 1921) | −20.7 (9 January 1987) | 1872.8 | 1157.0 | 117.1 (3 October 1935) | 211.0 (Aug) | 8.0 |
| Bordeaux [75] | 14.2 | 41.2 (23 July 2019) | −16.4 (Jan 16th,1985) | 2069.9 | 924.9 | 137.9 (25 September 1982) | 176.0 (sept) | 7.0 |
| Bourg-Saint-Maurice [76] | 10.5 | 38.4 (31 July. 1983) | −21.3 (6 January 1985) | 2008.9 | 975.6 | 101.2 (21 December 1991) | 186.9 (Feb) | 8.1 |
| Brest, France [77] | 11.7 | 39.3 (18 July 2022) | −14.0 (28 January 1947) | 1554.7 | 1229.8 | 82.6 (24 October 2011) | 138.1 (Jan) | 6.9 |
| Caen [78] | 11.5 | 40.1 (July 18th,2022) | −19.6 (8 January 1985) | 1746.2 | 740.3 | 183.9 (19 August 1996) | 189.4 (Ago) | 5.4 |
| Châteauroux [79] | 12.1 | 41.1 (July 25th,2019) | −22.8 (16 July 1985) | 1831.5 | 728.6 | 67.6 (4 June 2002) | 106.2 (Sept) | 6.2 |
| Clermont-Ferrand [80] | 12.1 | 40.9 (26 June 2019) | −29.0 (14 February 1929) | 1957.8 | 563.4 | 98.0 (5 June 1986) | 148.1 (Feb) | 5.7 |
| Cognac, France [81] | 13.7 | 40.3 (23 July 2019) | −19h.4 (15 February 1929) | 2042.8 | 771.8 | 116.1 (7 Apr 1986) | 152.1 (Apr) | 6.0 |
| Dijon [82] | 11.4 | 39.5 (23 July 2019) | −22.0 (15 February 1929) | 1890.1 | 743.4 | 110.1 (9 June 1953) | 226.5 (Nov) | 6.2 |
| Le Mans [83] | 12.4 | 41.1 (July 25th,2019) | −21.0 (29 December 1964) | 1808.6 | 693.4 | 85.30 (31 May 2008) | 113.0 (Jan) | 5.6 |
| Lille [84] | 11.3 | 41.5 (25 July 2019) | – 19.5 (14 January 1982) | 1627.5 | 740.0 | 62.8 (19 August 2005) | 107.6 (July) | 5.4 |
| Lyon [85] | 13.1 | 40.5 (July 25th,2019) | −24.6 (22 December 1938) | 2049.5 | 820.8 | 105.9 (May | 172.2 (Oct) | 8.2 |
| Marseille [86] | 15.9 | 39.7 (July 26th,1983) | −16.8 (12 February 1956) | 2897.6 | 532.3 | 212.3 (18 September 1932) | 212.4 (Sept) | 9.0 |
| Montélimar [87] | 14.2 | 41.1 (13 August 2003) | −17.2 (22 December 1938) | 2441.2 | 919.5 | 218.4 (26 September 1999) | 258.5 (Sept) | 10.4 |
| Nancy, France [88] | 11.0 | 40.1 (24 July 2019) | −24.8 (21 February 1956) | 1708.4 | 746.3 | 103.0 (21 May 2012) | 133.8 (May) | 5.6 |
| Nantes [89] | 12.7 | 42.0 (18 July 2022) | −15.6 (15 February 1956) | 1908.6 | 819.5 | 96.7 (2 October 2021) | 100.0 (Sept) | 6.0 |
| Nevers [90] | 11.4 | 39.4 (31 July 2020) | −25.0 (9 January 1985) | 1843.9 | 783.5 | 77.0 (Aug 28th,1983) | 320.1 (Dec) | 10.6 |
| Nice [91] | 16.3 | 37.7 (1 August 2006) | −7.2 (9 January 1985) | 2760.8 | 791.3 | 237.0 (18 December 1983) | 320.1 (Dec) | 10.6 |
| Nîmes [92] | 15.6 | 44.4 (28 June 2019) | −14.0 (23 February 1948) | 2679.9 | 734.4 | 266.8 (12 October 1990) | 329.4 (Sept) | 10.3 |
| Orléans [93] | 11.7 | 41.3 (July 25th,2019) | −19.8 (25 January 1940) | 1822.8 | 635.5 | 64.4 (15 July 1958) | 147.7 (July) | 5.3 |
| Parc Montsouris [94] | 12.8 | 42.6 (25 July 2019) | −23.9 (10 December 1879) | 1717.11 | 634.3 | 104.2 (July 6th,2001) | 112.4 7(July) | 5.6 |
| Pau, Pyrénées-Atlantiques [95] | 13.7 | 39.9 (1 August 1947) | −15.0 (13 February 1956) | 1909.7 | 1093.8 | 91.3 (June 12th,2018) | 161.8 (Dec) | 7.9 |
| Perpignan [96] | 16.0 | 42.4 (28 June 2019) | −11.0 (10 February 1956) | 2488.7 | 578.3 | 222.0 (12 November 1999) | 352.9 (Dec) | 9.3 |
| Poitiers [97] | 12.2 | 40.8 (27 July 1947) | −11.0 (10 February 1956) | 1940.7 | 695.3 | 92.3 (2 February 2011) | 116.0 (Nov) | 6.0 |
| Reims [98] | 11.3 | 41.1 (25 July 2019) | −12.8 (Jan 18th,2013) | 1919.6 | 559.7 | 71.4 (22 July 2016) | 96.7 (July) | 4.9 |
| Rennes [99] | 12.4 | 40.5 (18 July 2022) | −19.0 (14 February 1929) | 1761.6 | 691.0 | 80.6 (15 May 1971) | 104.4 (Jun) | 5.7 |
| Strasbourg [100] | 11.4 | 38.9 (25 July 2019) | −23.6 (23 January 1942) | 1747.3 | 635.7 | 66.3 (20 July 2014) | 121.6 (Sept) | 5.4 |
| Toulouse [101] | 14.2 | 40.7 (4 August 2003) | −19.2 (15 February 1956) | 2075.1 | 627.0 | 82.7 (7 July 1977) | 140.5 (Sept) | 6.4 |
Records
The highest temperature recorded by Météo-France in metropolitane France was 46.0 °C, measured in Vérargues, Hérault, on 28 June 2019, making France the sixth-highest-temperature country in Europe. [102]
The lowest temperature recorded by Météo France in mainland France was −36.7 °C, measured at Mouthe in Doubs on 13 January 1968. [103]
Precipitation records are set during Mediterranean episodes, some of which exceed 600 mm of rain per 24 hours. [104] For example, the 1940 aiguat reached 840 mm in 24 hours, the European record for rainfall intensity, [105] and extreme events of over 600 mm per 24 hours were recorded in 1827 in the Ardèche, in 1900 in the Gard, in 1982 in the Pyrénées-Orientales, in 1993 in Corsica, in 1999 in the Corbières and in 2002 in the Gard. [104]
Mount Aigoual (1,565 meters above sea level) in the Gard region of France holds the record for average annual precipitation, with 2,280 mm per year, and for the highest total annual precipitation, with 4,014 mm in 1913. [106]
The year 2022 is the hottest ever recorded in the country. [107]
In August 2023, records were set at a large number of stations: 43.2 °C at Carcassonne, 42.4 °C at Toulouse, 30.4 °C at Mont Aigoual. [108]
Meteorological overview
Meteorology is a science with a much shorter time scale than climatology. Its aim is to study atmospheric phenomena such as clouds, precipitation and wind, to understand how they form and evolve as a function of measured parameters such as pressure, temperature and humidity. An overview of some meteorological situations and phenomena is given below.
Typical weather situations in mainland France
The most frequent weather situations and associated weather types in mainland France are as follows: [109]
- Anticyclonic conditions: an anticyclone (often the Azores High) is centered over mainland France, pushing disturbances further north towards the British Isles. High-pressure conditions are synonymous with calm, generally dry weather.
- Disturbed westerly flow: this is generated by an area of low pressure associated with cold air aloft over the North Atlantic, and by the Azores anticyclone accompanied by warm subtropical air aloft. Between these two centers of action, the more or less rapid flow circulates from west to east over the Atlantic.
- South to south-westerly flow: The establishment of such a flow brings air masses of subtropical origin, laden with moisture and heat. In winter, this flow brings mildness and rain, while in summer it generates instability in the form of thunderstorms.
- North to northwest flow: when a low-pressure system is positioned or forms in the North Sea. This situation occurs fairly frequently in spring, autumn and winter
- Eastward flow, or blocking: disturbances affecting France generally move from west to east. However, in a few special cases, atmospheric circulation is reversed and disturbances affect the country from the east: this is known as an easterly return. This situation arises when high pressure is located at more northerly latitudes than usual. This prevents the circulation of conventional oceanic disturbances over Western Europe, which have no choice but to bypass this very northerly anticyclone and return to our country from the east. This configuration is known as a "blocking situation", as this powerful anticyclone holds out for several days. This is what happened in 2023, when for 15 days it was warmer in the north than in the south, with many records broken. [110] [111]
Winds

Wind direction and speed are largely determined by highs and lows. In the Northern Hemisphere, the wind blows counter-clockwise around a low-pressure system and clockwise around a high-pressure system. Its speed is proportional to the pressure difference between two points. The terrain can also channel the airflow. As a result, winds appear more frequently in certain regions and are more sustained: these are regional winds. [112] [113]
Some regional wind denominations actually coincide with a large-scale wind. For example, la bise is a common regional name for the cold, fairly dry north-to-northeasterly wind in central and eastern France and Switzerland, blowing mainly at high altitude. Other regional winds, on the other hand, have peculiarities of speed and direction that distinguish them from the large-scale wind: they reveal the existence of an interaction between certain topographical factors and the large-scale meteorological situation. These include the mistral (a cold, generally dry wind, blowing during the day at an average speed of 50 km/h with gusts in excess of 100 km/h across the lower Rhône valley and Provence, and invading the Mediterranean coastline from the Camargue onwards), the tramontane (a violent, cold, west to north-westerly wind crossing the foothills of the Pyrenees and the southern Massif Central mountains) or the marin (a south-easterly wind blowing across the entire Mediterranean coastal area). [112] [114]
Clouds and precipitation
In meteorology, a cloud is a visible mass initially made up of a large number of water droplets (sometimes ice crystals combined with chemical aerosols or minerals) suspended in the atmosphere above the surface of a planet. The appearance of a cloud depends on its nature, its size, the light it receives, and the number and distribution of its constituent particles. Clouds in the International Cloud Atlas are classified into ten genera, illustrated in the image opposite. [115] [116]
Météo-France distinguishes three main types of precipitation: Episodes of great geographical extent, affecting one or more departments, with heavy rainfall, usually of long duration (up to several days), but with no remarkable intensity; episodes of great geographical extent, affecting one or more departments, with very high intensities; and localized thunderstorms, which can, over a short period of time and within a limited perimeter, dump huge quantities of water. [117]
Extreme weather events
France's position in terms of disasters
According to a survey published in 2019 by the German association Germanwatch, France ranks 15th (out of 183 countries) among the nations most exposed to extreme weather events worldwide. The NGO estimates that nearly 500,000 people died worldwide over the period 1999–2018 as a result of one of the 12,000 exceptional climatic events that affected the globe. France would be the eighth most exposed country in terms of the number of deaths for the period 1999–2018 in relation to its total population, mainly due to several deadly heatwaves: that of 2003 (15,000 deaths), 2006 (1,800) and 2018 (1,500). [118] Météo France states that, to date, global warming "has not been accompanied by any notable changes in the frequency and intensity of storms across France, nor in the number and intensity of heavy rainfall events in the South-East". [119] According to meteorologist Guillaume Séchet, "as a result of global warming, it is estimated that by 2100 France will experience around 20% more Mediterranean episodes ", with more dramatic consequences due to increasing soil sealing and demographic pressure in the regions concerned. [120]
Historical storms
Every year, several storms hit mainland France, each with its own specific characteristics (trajectory, size, speed, stage of development, etc.). The areas affected and the damage caused are highly variable, but two main types of storm can be distinguished. [121]
- Oceanic storms: the most exposed regions are between Pays de la Loire and Normandy and, to a lesser extent, Poitou-Charentes, as well as an area stretching from Île-de-France to the north and Alsace. The south-west is less frequently affected, particularly the inland areas, which are rarely affected (although Aquitaine has experienced at least eight wind disasters, including three prior to 1850, i.e. before the end of the Little Ice Age, and two particularly severe ones in more recent times, in 1893 and 1915). [7]
- Mediterranean storms: these mainly affect the south-east of France and the Massif Central, but can sometimes spill over into neighboring regions. They are often longer-lasting than oceanic storms, and can therefore cause considerable damage.
The most notable recent storms are Lothar ( 25 and 26 December 1999), Martin ( 27 and 28 December 1999), Klaus (24 January 2009), Xynthia ( 27 and 28 February 2010) and Alex ( 1 and 2 October 2020). [121]
Historic floods
Since 1930, 17 disastrous floods have caused more than 5 deaths, 7 of them more than 20. [122]
- On 3 March 1930, flooding of the Tarn, Agout and their tributaries inundated many towns, particularly Moissac and Montauban. They destroyed 3,000 homes and 9 major bridges. Nearly 200 people died, including 130 in Moissac. [123] [124]
- in 1940, violent rainfall caused several rivers in Catalonia to overflow their banks, flooding the Pyrénées-Orientales region in particular. Over 300 people died in Catalonia and 57 in France, almost half of them in Amélie-les-Bains [125] and the surrounding area.
- On 14 July 1987, violent storms caused the Borne River to overflow its banks in Haute-Savoie, killing 23 people in Le Grand-Bornand. [126]
- On 22 September 1992, the Ouvèze overflowed its banks and flooded the town of Vaison-la-Romaine (Vaucluse), killing 47 people, including 34 in Vaison-la-Romaine. [127]
- In November 1999, several rivers in the southern Mediterranean region overflowed their banks. The floods claimed 35 lives. 438 communes were affected. [128]
- on 8 and 9 September 2002, more than 5,000 km2 (an area almost the size of the Gard department) received rainfall in excess of 200 mm over 2 days, with a maximum of around 700 mm. The floods claimed 24 lives. 419 communes were affected [129]
- On 15 June 2010, in the city of Draguignan, but also nearby in Figanières, Trans-en-Provence, Le Luc, Fréjus, Saint-Aygulf and Le Muy, runoff and river overflows caused 23 casualties. [130]
Historical heat waves and droughts
Heat waves and droughts
Three heat waves were recorded between 1976 and 2003. The summer of 1976 is remembered for the drought that caused the worst agricultural damage, but it was above all a major heatwave in which some twenty départements saw their mortality rates rise by more than 10% above seasonal norms, representing 6,000 excess deaths that went unnoticed at the time. [131] The July 1983 heatwave in south-eastern France resulted in 4,700 excess deaths across the whole of France. 1994 was the second hottest summer in the 50-year period preceding 2003. [131]
After 2003, seven notable heatwaves can be counted: 2006, 2015, 2017, 2018, 2019, 2020 and 2022. With three heatwaves, the summer of 2022 was the deadliest since 2003, with 2,816 deaths137 , compared with more than 15,000 in 2003. [132] [133]
Droughts
The drought of 1976, described by then President Valéry Giscard d'Estaing as a "national calamity", was one of the worst in France's history. A 2.2 billion franc aid package for farmers was decided. It was partly financed by an exceptional drought tax based on income tax, paid by over 3 million taxpayers, 9.5 million of whom were exempt. The total amount of drought aid was set at 6 billion euros on 22 September 1976, 90% of which went to livestock farmers, according to departmental distribution. [134]
The drought of 2022 has also been described as historic. The temperature anomaly reached +3.8 °C over the months of May, June, July and August, compared with the 1960–1990 period. [135] July 2022 was the second driest month on record in France, after March 1961, with a precipitation deficit of around 84% compared with the 1991–2020 period. As of 4 August 2022, 62 departments, mainly in the western and southern halves of the country, were at maximum drought "crisis" alert level, with significant restrictions on water abstraction. [134] [136]
Climate change

The average temperature in mainland France in 2022 was 14.5 °C, the highest on record. This is 1.66 °C higher than temperatures measured between 1900 and 1930, with 1.63 °C attributable solely to human activity. Analysis of more precise temperature data between 2010 and 2019 shows that, over this short period, France is warming by 0.1 °C every 3 years. Climate projections produced by Météo-France in 2021 predict a temperature rise of 2.2 degrees in France by 2100, based on the RCP 4–5 intermediate scenario of the IPCC's Sixth Assessment Report. However, according to a study published in October 2022 by several scientific institutions, including the Centre national de la recherche scientifique (CNRS) and Météo-France, the temperature rise in France could reach 3.8 degrees in 2100 on the basis of this scenario, i.e. up to 50% more intense over the course of the century than previous estimates showed.
The impacts of global warming are already visible and are set to intensify, whether they be environmental ( coastal erosion and flooding, species migration or extinction, increases in invasive species, adaptation, migration or extinction of marine species or mangroves), societal (agricultural model under severe threat, heat islands in certain cities), health (drinking water supply, new risks such as chikungunya or dengue fever) or economic (conversion of certain winter sports resorts).
France's climate policy
To meet the two objectives of the Paris climate agreement (warming well below 2 °C and preferably limited to 1.5 °C), a sharp and immediate reduction in CO2 emissions is essential, until carbon neutrality is achieved in 2050, the only way to halt global warming. Reducing emissions of other greenhouse gases, particularly methane, is also relevant. To meet this objective, France, through its climate policy, is deploying various mitigation and adaptation strategies), with specific targets such as reducing greenhouse gas emissions by 50% between 1990 and 2030 (20% in 2019) or reducing final energy consumption by 50% in 2050 compared with the 2012 baseline, with an intermediate target of 20% in 2030.
See also
References
- ^ "De nouvelles normales pour qualifier le climat en France | Météo-France". meteofrance.com. Retrieved 26 February 2024.
- ^ Bernard, Vincent; Cassou, Christophe; Castège, Iker; Chaalali, Aurélie; Idier, Déborah; Le Cozannet, Gonéri; Planton, Serge; Ribes, Aurélien. "Du climat global au climat régional.". Les impacts du changement climatique. Pessac: Presses Universitaires de Bordeaux.
- ^ "Outre-mer français et européen (statuts)". 2023.
- ^ a b Bréon & Luneau (2021, p. 16)
- ^ Deconinck (2006, pp. 148–149)
- ^ "Conférences sur l'archéologie. Les changements climatiques rapides de la dernière période glaciaire et la fin des Néandertaliens". Inrap (in French). 12 January 2010. Retrieved 26 February 2024.
- ^ a b c Grousset, Francis (2013). "Chapitre 2 : Du climat du passé au climat du futur". Les impacts du changement climatique en Aquitaine, À la croisée des sciences. Presses Universitaires de Bordeaux. ISBN 979-10-300-0374-1.
- ^ Michel, François (2005). Roches et paysages, reflets de l'histoire de la Terre. Paris: brgm éditions. p. 154. ISBN 2-7011-4081-1.
- ^ Valentin, Boris; Bodu, Pierre; Julien, Michèle (2004). "Habitats et peuplements tardiglaciaires du Bassin parisien. Projet collectif de recherche 2003–2005". Rapport d'activité pour 2004.: 88–94.
- ^ Valentin, Boris (27 October 1995). Les groupes humains et leurs traditions au Tardiglaciaire dans le Bassin parisien. Apports de la technologie lithique comparée (phdthesis thesis) (in French). Université Panthéon-Sorbonne – Paris I.
- ^ a b Pigeaud, Romain (2023). "Les grottes ornées, témoins du climat ?". Dossiers d'archéologie. 16. ISSN 1141-7137.
- ^ Valentin, Boris (27 October 1995). Les groupes humains et leurs traditions au Tardiglaciaire dans le Bassin parisien. Apports de la technologie lithique comparée (phdthesis thesis) (in French). Université Panthéon-Sorbonne – Paris I.
- ^ Naudinot, Nicolas; Fagnart, Jean-Pierre; Langlais, Mathieu; Mevel, Ludovic; Valentin, Boris (1 December 2019). "Les dernières sociétés du Tardiglaciaire et des tout débuts de l'Holocène en France". Gallia Préhistoire (in French) (59): 5–45. doi: 10.4000/galliap.1394. ISSN 0016-4127. S2CID 194347978.
- ^ Martin, Pierre. Ces risques que l'on dit naturels (Eyrolles, 2006). p. 14.
- ^ Hughes, Philip D.; Woodward, Jamie C (2008). "Timing of glaciation in the Mediterranean mountains during the last cold stage" (PDF). Journal of Quaternary Science. 23 (6–8): 575–588. Bibcode: 2008JQS....23..575H. doi: 10.1002/jqs.1212. S2CID 56429143.
- ^ Bard, Édouard (2013). "Le dernier réchauffement climatique". La Recherche (474): 54–57.
- ^ a b c Brewer, Davis (2003). "Guiot et contributeurs de données, The temperature of Europe during the Holocene reconstructed from pollen data". Quaternary Science Reviews. 22 (15–17). doi: 10.1016/S0277-3791(03)00173-2.
- ^ a b Méhu, Jean. "Évolution climatique". Histoire du Luberon.
- ^ Berger, Jean-François (2010), Demoule, Jean-Paul (ed.), "Les changements climato-environnementaux de l'Holocène ancien et la néolithisation du bassin méditerranéen", La révolution néolithique dans le monde, CNRS Alpha (in French), Paris: CNRS Éditions, pp. 121–144, ISBN 978-2-271-12986-4, retrieved 27 February 2024
- ^ Bernigaud, Nicolas (2023). "Les sociétés face aux changements climatiques en Gaule". Dossiers d'archéologie (416): 48–51. ISSN 1141-7137.
- ^ a b "Les climats". Une géohistoire. pp. 30–31.
- ^ "Les climats". Une géohistoire. pp. 28–29.
- ^ "Les climats". Une géohistoire. pp. 36–37.
- ^ a b "Les climats". Une géohistoire. p. 43.
- ^ Peel; Finlayson; McMahon (2007). "Updated world map of the Köppen-Geiger climate classification". Hydrology and Earth System Sciences. 11 (5): 1633–1644. Bibcode: 2007HESS...11.1633P. doi: 10.5194/hess-11-1633-2007. ISSN 1027-5606.
- ^ Les types de climats en France, une construction spatiale.
- ^ "type 1". Les types de climats en France, une construction spatiale.
- ^ "type 2". Les types de climats en France, une construction spatiale.
- ^ "type 3". Les types de climats en France, une construction spatiale.
- ^ "type 4". Les types de climats en France, une construction spatiale.
- ^ "type 5". Les types de climats en France, une construction spatiale.
- ^ "type 6". Les types de climats en France, une construction spatiale.
- ^ "type 7". Les types de climats en France, une construction spatiale.
- ^ "type 8". Les types de climats en France, une construction spatiale.
- ^ "Le climat en France métropolitaine | Météo-France". meteofrance.com. Retrieved 28 February 2024.
- ^ "Normales et records climatologiques 1971–2000 à Brest-Guipavas – Infoclimat". www.infoclimat.fr. Retrieved 28 February 2024.
- ^ "Normales et records climatologiques 1981–2010 à Brest-Guipavas – Infoclimat". www.infoclimat.fr. Retrieved 28 February 2024.
- ^ "Normales et records climatologiques 1991–2020 à Brest-Guipavas – Infoclimat". www.infoclimat.fr. Retrieved 28 February 2024.
- ^ "Normales et records climatologiques 1971–2000 à Orléans – Bricy – Infoclimat". www.infoclimat.fr. Retrieved 28 February 2024.
- ^ "Normales et records climatologiques 1981–2010 à Orléans – Bricy – Infoclimat". www.infoclimat.fr. Retrieved 28 February 2024.
- ^ "Normales et records climatologiques 1991–2020 à Cambrai-Epinoy – Infoclimat". www.infoclimat.fr. Retrieved 28 February 2024.
- ^ "Normales et records climatologiques 1971–2000 à Cambrai-Epinoy – Infoclimat". www.infoclimat.fr. Retrieved 28 February 2024.
- ^ "Normales et records climatologiques 1981–2010 à Cambrai-Epinoy – Infoclimat". www.infoclimat.fr. Retrieved 28 February 2024.
- ^ "Normales et records climatologiques 1991–2020 à Cambrai-Epinoy – Infoclimat". www.infoclimat.fr. Retrieved 28 February 2024.
- ^ "Normales et records climatologiques 1971–2000 à Besançon – Thise – Infoclimat". www.infoclimat.fr. Retrieved 28 February 2024.
- ^ "Normales et records climatologiques 1981–2010 à Besançon – Thise – Infoclimat". www.infoclimat.fr. Retrieved 28 February 2024.
- ^ "Normales et records climatologiques 1991–2020 à Besançon – Thise – Infoclimat". www.infoclimat.fr. Retrieved 28 February 2024.
- ^ "Normales et records climatologiques 1971–2000 à Bourg-St-Maurice – Infoclimat". www.infoclimat.fr. Retrieved 28 February 2024.
- ^ "Normales et records climatologiques 1981–2010 à Bourg-St-Maurice – Infoclimat". www.infoclimat.fr. Retrieved 28 February 2024.
- ^ "Normales et records climatologiques 1991–2020 à Bourg-St-Maurice – Infoclimat". www.infoclimat.fr. Retrieved 28 February 2024.
- ^ "Normales et records climatologiques 1971–2000 à Marseille–Marignane (Marseille Provence) – Infoclimat". www.infoclimat.fr. Retrieved 28 February 2024.
- ^ "Normales et records climatologiques 1981–2010 à Marseille–Marignane (Marseille Provence) – Infoclimat". www.infoclimat.fr. Retrieved 28 February 2024.
- ^ "Normales et records climatologiques 1991–2020 à Marseille–Marignane (Marseille Provence) – Infoclimat". www.infoclimat.fr. Retrieved 28 February 2024.
- ^ "Un peu de géographie – Pluies extrêmes en France métropolitaine". pluiesextremes.meteo.fr. Retrieved 28 February 2024.
- ^ Dandin, Philippe; Planton, Serge (2011), Jeandel, Catherine; Mosseri, Rémy (eds.), "2. Observations météorologiques et de surface continentale", Le climat à découvert, À découvert (in French), Paris: CNRS Éditions, pp. 88–91, ISBN 978-2-271-11916-2, retrieved 29 February 2024
- ^ Lemaire, Jean; Pigeon, Grégoire (2015). "Aurelhy, ETPQ, Safran et Digitalis : des données climatiques spatialisées pour un diagnostic de qualité". Forêt-entreprise. Paris: Centre national de la propriété forestière (CNPF). pp. 46–52.
- ^ a b c d e LeTreut, Hervé (2013). "Du climat global au climat régional". Les impacts du changement climatique en Aquitaine, À la croisée des sciences (in French). Pessac: Presses Universitaires de Bordeaux. pp. 19–40. ISBN 979-10-300-0374-1.
- ^ "De nouvelles normales pour qualifier le climat en France | Météo-France". meteofrance.com. Retrieved 29 February 2024.
- ^ Canellas, Claire; Gibelin, Anne-Laure; Lassègues, Pierre; Kerdoncuff, Maryvonne; Dandin, Philippe; Simon, Pascal (2014). "Les normales climatiques spatialisées Aurelhy 1981–2010 : températures et précipitations". La Météorologie (in French). 2014 (85): 47–55. doi: 10.4267/2042/53750. ISSN 2107-0830.
- ^ "ARPEGE-Climat – Centre National de Recherches Météorologiques". www.umr-cnrm.fr. Retrieved 29 February 2024.
- ^ "Meteociel – Modèle Numérique ARPEGE Meteo-France". www.meteociel.fr. Retrieved 29 February 2024.
- ^ "ARPEGE – Centre National de Recherches Météorologiques". www.umr-cnrm.fr. Retrieved 29 February 2024.
- ^ "AROME – Centre National de Recherches Météorologiques". www.umr-cnrm.fr. Retrieved 29 February 2024.
- ^ "My CMS – Climate Modeling Center" (in French). Retrieved 29 February 2024.
- ^ "Recherche – Approches méthodologiques – Laboratoire de Météorologie Dynamique" (in French). Retrieved 29 February 2024.
- ^ "De nouvelles normales pour qualifier le climat en France | Météo-France". meteofrance.com. Retrieved 29 February 2024.
- ^ a b c d "Impacts du changement climatique : Atmosphère, Températures et Précipitations". Ministère de la Transition Écologique et de la Cohésion des Territoires (in French). Retrieved 29 February 2024.
- ^ "Envidat". envidat.ch. Retrieved 29 February 2024.
- ^ "Régimes pluviométriques – Pluies extrêmes en France métropolitaine". pluiesextremes.meteo.fr. Retrieved 29 February 2024.
- ^ "Des pluies qui peuvent être diluviennes – Pluies extrêmes en France métropolitaine". pluiesextremes.meteo.fr. Retrieved 29 February 2024.
- ^ "Indicateur national climatologique – Infoclimat". www.infoclimat.fr. Retrieved 29 February 2024.
- ^ "Normales et records climatologiques 1991–2020 à Agen – La Garenne – Infoclimat". www.infoclimat.fr. Retrieved 29 February 2024.
- ^ "Normales et records climatologiques 1991–2020 à Bastia – Poretta – Infoclimat". www.infoclimat.fr. Retrieved 29 February 2024.
- ^ "Normales et records climatologiques 1991–2020 à Besançon – Thise – Infoclimat". www.infoclimat.fr. Retrieved 29 February 2024.
- ^ "Normales et records climatologiques 1991–2020 à Bordeaux-Mérignac – Infoclimat". www.infoclimat.fr. Retrieved 29 February 2024.
- ^ "Normales et records climatologiques 1991–2020 à Bourg-St-Maurice – Infoclimat". www.infoclimat.fr. Retrieved 29 February 2024.
- ^ "Normales et records climatologiques 1991–2020 à Brest-Guipavas – Infoclimat". www.infoclimat.fr. Retrieved 29 February 2024.
- ^ "Normales et records climatologiques 1991–2020 à Caen-Carpiquet – Infoclimat". www.infoclimat.fr. Retrieved 29 February 2024.
- ^ "Normales et records climatologiques 1991–2020 à Châteauroux – Déols – Infoclimat". www.infoclimat.fr. Retrieved 29 February 2024.
- ^ "Normales et records climatologiques 1991–2020 à Clermont-Ferrand – Aulnat – Infoclimat". www.infoclimat.fr. Retrieved 29 February 2024.
- ^ "Normales et records climatologiques 1991–2020 à Cognac-Châteaubernard – Infoclimat". www.infoclimat.fr. Retrieved 29 February 2024.
- ^ "Normales et records climatologiques 1991–2020 à Dijon-Longvic – Infoclimat". www.infoclimat.fr. Retrieved 29 February 2024.
- ^ "Normales et records climatologiques 1991–2020 à Le Mans – Arnage – Infoclimat". www.infoclimat.fr. Retrieved 29 February 2024.
- ^ "Normales et records climatologiques 1991–2020 à Lille-Lesquin – Infoclimat". www.infoclimat.fr. Retrieved 29 February 2024.
- ^ "Normales et records climatologiques 1991–2020 à Lyon-Bron – Infoclimat". www.infoclimat.fr. Retrieved 29 February 2024.
- ^ "Normales et records climatologiques 1991–2020 à Marseille–Marignane (Marseille Provence) – Infoclimat". www.infoclimat.fr. Retrieved 29 February 2024.
- ^ "Normales et records climatologiques 1991–2020 à Montélimar – Ancone – Infoclimat". www.infoclimat.fr. Retrieved 29 February 2024.
- ^ "Normales et records climatologiques 1991–2020 à Nancy-Essey – Infoclimat". www.infoclimat.fr. Retrieved 29 February 2024.
- ^ "Normales et records climatologiques 1991–2020 à Nantes-Atlantique – Infoclimat". www.infoclimat.fr. Retrieved 29 February 2024.
- ^ "Normales et records climatologiques 1991–2020 à Nevers-Marzy – Infoclimat". www.infoclimat.fr. Retrieved 29 February 2024.
- ^ "Normales et records climatologiques 1991–2020 à Nice – Côte d'Azur – Infoclimat". www.infoclimat.fr. Retrieved 29 February 2024.
- ^ "Normales et records climatologiques 1991–2020 à Nimes-Courbessac – Infoclimat". www.infoclimat.fr. Retrieved 29 February 2024.
- ^ "Normales et records climatologiques 1991–2020 à Orléans – Bricy – Infoclimat". www.infoclimat.fr. Retrieved 29 February 2024.
- ^ "Normales et records climatologiques 1991–2020 à Paris-Montsouris – Infoclimat". www.infoclimat.fr. Retrieved 29 February 2024.
- ^ "Normales et records climatologiques 1991–2020 à Pau-Uzein – Infoclimat". www.infoclimat.fr. Retrieved 29 February 2024.
- ^ "Normales et records climatologiques 1991–2020 à Perpignan – Rivesaltes – Infoclimat". www.infoclimat.fr. Retrieved 29 February 2024.
- ^ "Normales et records climatologiques 1991–2020 à Poitiers-Biard – Infoclimat". www.infoclimat.fr. Retrieved 29 February 2024.
- ^ "Normales et records climatologiques 1991–2020 à Reims-Champagne – Infoclimat". www.infoclimat.fr. Retrieved 29 February 2024.
- ^ "Normales et records climatologiques 1991–2020 à Rennes-St Jacques – Infoclimat". www.infoclimat.fr. Retrieved 29 February 2024.
- ^ "Normales et records climatologiques 1991–2020 à Strasbourg-Entzheim – Infoclimat". www.infoclimat.fr. Retrieved 29 February 2024.
- ^ "Normales et records climatologiques 1991–2020 à Toulouse-Blagnac – Infoclimat". www.infoclimat.fr. Retrieved 29 February 2024.
- ^ "Quelle est la température la plus élevée enregistrée en France?". Météo France.
- ^ "METEO FRANCE – Le site institutionnel de Météo-France". meteofrance.fr. Retrieved 29 February 2024.
- ^ a b "Événements paroxystiques – Pluies extrêmes en France métropolitaine". pluiesextremes.meteo.fr. Retrieved 29 February 2024.
- ^ "Aïguat fantastique sur le Roussillon – Pluies extrêmes en France métropolitaine". pluiesextremes.meteo.fr. Retrieved 29 February 2024.
- ^ "Pluies extrêmes en France Métropolitaine – Bienvenue sur le site des pluies extrêmes sur la France métropolitaine". pluiesextremes.meteo.fr. Retrieved 29 February 2024.
- ^ Lacroux, Margaux. "Climat : 2022 pulvérise le record de l'année la plus chaude en France". Libération (in French). Retrieved 29 February 2024.
- ^ "La canicule en France : visualisez les températures dépassées en août 2023 : 43,2 °C à Carcassonne, 42,4 °C à Toulouse, 30,4 °C au mont Aigoual..." Le Monde.fr (in French). 24 August 2023. Retrieved 29 February 2024.
- ^ "Les situations météorologiques types en France | Météo-France". meteofrance.com. Retrieved 29 February 2024.
- ^ "Météo : il fait chaud et ce n'est pas près de s'arrêter". Le Point (in French). 12 June 2023. Retrieved 29 February 2024.
- ^ "Météo : Toujours plus sec et plus chaud au nord qu'au sud ; pourquoi ? | Météo-France". meteofrance.com. Retrieved 29 February 2024.
- ^ a b "Les vents régionaux | Météo-France". meteofrance.com. Retrieved 29 February 2024.
- ^ "Les vents régionaux – Tempêtes en France métropolitaine". tempetes.meteo.fr. Retrieved 29 February 2024.
- ^ "Les vents régionaux méditerranéens – Tempêtes en France métropolitaine". tempetes.meteo.fr. Retrieved 29 February 2024.
- ^ WMO. "Genera". International Cloud Atlas. Retrieved 29 February 2024.
- ^ "Les différents types de nuages | Météo-France". meteofrance.com. Retrieved 29 February 2024.
- ^ "Typologie des précipitations – Pluies extrêmes en France métropolitaine". pluiesextremes.meteo.fr. Retrieved 29 February 2024.
- ^ Mouchon, Frédéric (2019). "Canicules, tempêtes, inondations : la France est devenue un des pays les plus exposés au monde". leparisien.fr (in French). Retrieved 29 February 2024.
- ^ "METEO FRANCE – Le site institutionnel de Météo-France". meteofrance.fr. Retrieved 29 February 2024.
- ^ Mouchon, Frédéric (2019). "Canicules, tempêtes, inondations : la France est devenue un des pays les plus exposés au monde". leparisien.fr (in French).
- ^ a b "Les tempêtes remarquables en France | Météo-France". meteofrance.com. Retrieved 29 February 2024.
- ^ "Les inondations les plus catastrophiques en France depuis 1900". Le Monde.fr (in French). 3 June 2016. Retrieved 1 March 2024.
- ^ "Cent ans d'inondations historiques en France". La Croix (in French). 14 March 2010. ISSN 0242-6056. Retrieved 1 March 2024.
- ^ "Le Sud-Ouest ravagé par les inondations – Pluies extrêmes en France métropolitaine". pluiesextremes.meteo.fr. Retrieved 1 March 2024.
- ^ "Aïguat fantastique sur le Roussillon – Pluies extrêmes en France métropolitaine". pluiesextremes.meteo.fr. Retrieved 1 March 2024.
- ^ "Catastrophe du Grand Bornand – Pluies extrêmes en France métropolitaine". pluiesextremes.meteo.fr. Retrieved 1 March 2024.
- ^ "Vaison la Romaine : la catastrophe – Pluies extrêmes en France métropolitaine". pluiesextremes.meteo.fr. Retrieved 1 March 2024.
- ^ "Catastrophe sur les Corbières – Pluies extrêmes en France métropolitaine". pluiesextremes.meteo.fr. Retrieved 1 March 2024.
- ^ "Catastrophe sur le Gard – Pluies extrêmes en France métropolitaine". pluiesextremes.meteo.fr. Retrieved 1 March 2024.
- ^ "Catastrophe de Draguignan – Pluies extrêmes en France métropolitaine". pluiesextremes.meteo.fr. Retrieved 1 March 2024.
- ^ a b "La France et les Français face à la canicule : les leçons d'une crise". Sénat (in French). 3 April 2023. Retrieved 1 March 2024.
- ^ "La canicule de 2003, un tournant démographique". Le Monde.fr (in French). 27 June 2019. Retrieved 1 March 2024.
- ^ "Retour sur les canicules en France depuis 2003". Les Echos (in French). 11 August 2022. Retrieved 1 March 2024.
- ^ a b "Retour sur les sécheresses en France depuis 1976". Les Echos (in French). 5 August 2022. Retrieved 1 March 2024.
- ^ "2022, une année « hors normes, symptôme du dérèglement climatique »". Le Monde.fr (in French). 30 November 2022. Retrieved 1 March 2024.
- ^ "Sécheresse et chaleur : un mois de juillet 2022 historique". Le Monde.fr (in French). 2 August 2022. Retrieved 1 March 2024.
Bibliography
- External media: Les grandes crises climatiques 3/4 : Le petit âge glaciaire – Les grandes crises climatiques 1/4 : Charlotte Vorms et Jean-François Berger
- Statistiques climatiques de la France 1971–2000. Direction de la Climatologie. 2009. p. 287. ISBN 978-2110987181.
- Joly, Daniel; Brossard, Thierry; Cardot, Hervé; Cavailhes, Jean; Hilal, Mohamed; Wavresky, Pierre (2010). "Les types de climats en France, une construction spatiale". Cybergéo, revue européenne de géographie – European Journal of Geography (501).
- Dandin, Philippe; Planton, Serge (2011). Jeandel, Catherine; Mosseri, Rémy (eds.). Le climat à découvert. CNRS Éditions. doi: 10.4000/books.editionscnrs.11316. ISBN 978-2-271-07198-9.
- Valette, Philippe (2021). Les climats - Une géohistoire - Documentation photographique. Paris: CNRS Editions. ISSN 0419-5361.
- Le Roy Ladurie, Emmanuel (2004). Histoire humaine et comparée du climat, volume 1 : Canicules et glaciers (xiiie – xviiie siècles). Paris: Fayard. ISBN 2-213-61921-2.
- Le Roy Ladurie, Emmanuel (2006). Histoire humaine et comparée du climat, volume 2 : Disettes et révolutions (1740-1860). Paris: Fayard. ISBN 2-213-62738-X.
- Deconinck, Jean-François (2006). Paléoclimats - l'enregistrement des variations climatiques. Paris: Vuibert. ISBN 2-7117-5395-6.
- Bréon, François-Marie; Luneau, Gilles (2021). Atlas du climat. Paris.
ISBN
978-2-7467-6208-4.
{{
cite book}}
: CS1 maint: location missing publisher ( link)
The climate of France is the statistical distribution of conditions in the earth's atmosphere over the national territory, based on the averages and variability of relevant quantities over a given period, the standard reference period defined by the World Meteorological Organization being 30 years. Climate characterization is based on annual and monthly statistical measurements of local atmospheric data: temperature, atmospheric pressure, precipitation, sunshine, humidity, wind speed. Recurrence and exceptional events are also taken into account.
Located between latitudes 41° 19' N and 51° 04'N, metropolitan France is currently in the temperate zone, characterized by warm summers and moderately cold winters. This classification distinguishes between oceanic (cool summers, mild winters, high precipitation), continental (hot summers, cold winters, low precipitation), Mediterranean (hot, dry summers, mild winters, autumn precipitation), mountain (colder and wetter than the surrounding plains) and altered oceanic (a transition zone between oceanic and mountain climates and semi-continental climate). Extreme temperatures recorded in mainland France are 46.0 °C in Vérargues on 28 June 2019 and −36.7 °C in Mouthe on 13 January 1968.
The climates of France's overseas territories are many and varied, depending on their position on the globe, ranging from the cold oceanic type for the subantarctic islands, to the tropical maritime type for the French West Indies, the equatorial type for French Guiana and the polar maritime type for Saint-Pierre-et-Miquelon. French Polynesia, which extends over 20 degrees of latitude, is divided into 5 types.
These climates have varied greatly in the past, with warm periods (optimums) and cold periods (ice ages). Paleoclimates, which date back to geological times, have been marked by alternating ice ages (around 80,000 years) and warm periods (around 20,000 years) at intervals of around 100,000 years. The last Ice Age was a period of global cooling, or glaciation, which marked the end of the Pleistocene on the entire planet. It began 115,000 years ago and ended 11,700 years ago, when the Holocene, the current interglacial period, began. The latter is characterized by the Roman climatic optimum (−300 to +200), the Medieval climatic optimum (900–1300) and the Little Ice Age (1300–1860). The contemporary period (1860 to the present) is marked by the end of the Alpine Little Ice Age (1860-1900-1910), followed by the onset of global warming.
The IPCC's sixth assessment report confirms with certainty the anthropization origin of the global warming already observed. Temperatures in mainland France today are 1.66 °C higher than those measured between 1900 and 1930, with 1.63 °C attributable solely to human activity. Analysis of more precise temperature data between 2010 and 2019 shows that, over this short period, France is warming by 0.1 °C every 3 years. To meet the two objectives of the Paris climate agreement (warming well below 2 °C and preferably limited to 1.5 °C), a sharp and immediate reduction in CO2 emissions is essential, until we reach carbon neutrality, the only way to halt global warming. Reducing emissions of other greenhouse gases, particularly methane, is also relevant. To meet this objective, France, through its climate policy, is deploying various mitigation and adaptation strategies, with specific targets such as reducing greenhouse gas emissions by 40% between 1990 and 2030 (20% in 2019) or reducing final energy consumption by 50% in 2050 compared with the 2012 baseline, with an intermediate target of 20% in 2030.
Notion of climate
The notion of climate has evolved considerably, and it's now easier to define what the "climate system" is, i.e. all the very different components that make up the atmosphere, the oceans, the continental surface, and all their physical, chemical and biological interactions. The word "climate" thus goes beyond the usual strictly atmospheric definition to designate the characteristics of the climate system in a given place, characteristics established over a period, often 30 years, known as the Climate Norm. [1] The parameters used to describe a region's climate are many and varied, from temperature, wind and air humidity to soil water content, river conditions, atmospheric composition and ocean salinity. They are most often analyzed in terms of annual, monthly or seasonal averages. But characterizing climate also means describing rarer and more irregular events, such as violent storms or persistent drought. [2]
France is a transcontinental sovereign state whose metropolitan territory extends across Western Europe, and whose overseas territories stretch across the Indian, Atlantic and Pacific oceans, as well as Antarctica and South America. [3] It is thus characterized by a wide variety of climates, which have also been highly variable over time.
Paleoclimates
Milanković cycles
Life appeared on Earth between 3.8 and 3.5 billion years ago, in the form of the first cells. It was the first living organisms capable of recovering carbon from atmospheric CO2 dissolved in water and progressively enriching the atmosphere with oxygen ( photosynthesis) that set in motion the dynamic cycle of water and climate. The first hominids appeared around 4 million years ago. Ice core records provide a good understanding of the climate over the last million years. It is marked by alternating ice ages (around 80,000 years) and warm periods (around 20,000 years) with a periodicity of around 100,000 years. Since the appearance of man, the average temperature at the Earth's surface has been relatively constant, varying by only a few degrees from an average of around 15 °C. [4]
The regular alternation of warm and cold periods can be explained by astronomy. In 1924, Serbian geophysicist Milutin Milanković demonstrated that three independent parameters characterize the Earth's orbit around the sun and modulate the amount of solar energy according to the seasons: eccentricity, obliquity, the inclination of the Earth's axis of rotation on itself in relation to the plane of rotation around the sun (currently close to 23°) and climatic precession, a term defining variations in the Earth's axis of rotation. Each of these parameters varies over time with independent periods, and their conjunction makes the construction, or disappearance, of icecaps in the Northern Hemisphere more or less favorable, and these icecaps play a decisive role in climate. [4] In France, the South-East basin, considered part of the Alpine domain, stands out from other French geological basins for the very great thickness of its sedimentary layer. Alternating marl and limestone deposits are particularly well exposed in the Vocontian Basin, where Lower Cretaceous formations are mostly in the form of alternating limestone banks and marl interbanks. These alternating sedimentary successions perfectly reflect the interlocking Milanković cycles, providing one of the best proofs of astroclimatic control of sedimentation. [5]
Last Ice Age (−115,000 to −11,700 years ago)
Last Ice Age (−115,000 to −19,000 years ago)
The Last Ice Age is a period of global cooling, or glaciation, that marks the end of the Pleistocene on the entire planet. It began 115,000 years ago and ended 11,700 years ago, when the Holocene began.
Abrupt changes of millennial cyclicity punctuated this last glacial period and had a strong impact on terrestrial and marine ecosystems, as well as on atmospheric composition and temperature. Periods characterized by rising water temperatures in the North Atlantic, Greenland and greenhouse gas concentrations were contemporary with the development of forest in Europe below 50°N, and alternated with cold periods of steppe vegetation. During the changes observed around 40,000 years before present, Neanderthal man disappeared and modern man colonized Europe. [6]
These changes, known as the Dansgaard-Oeschger cycles after their discoverers, have given rise to some forty very rapid climatic pulsations. These phases are associated with variations in North Atlantic surface water temperature and changes in climate on the European continent. These pulses lasted for several millennia, and the transition from a cold episode (stage) to a temperate episode (interstage) seems to have been very rapid, on the order of a few decades, sometimes less! Some of these cold episodes were accompanied by a massive influx of icebergs into the Bay of Biscay from the ice cap covering Canada. These iceberg break-ups, known as Heinrich events, were brutal: each would have lasted on the order of a century, or even a few millennia. Studies of Bay of Biscay sediments have shown that each Heinrich event is synchronous with the rapid development (< 100 years) of a "Central European-type" grass steppe at the expense of pine forest. [7]
The glacial maximum was reached around 21,000 years ago. One of the consequences of this cooling was a marine regression (a general drop in sea level) of around 120 meters at its maximum, [8] and the establishment of a periglacial climate in Europe, North Asia and North America, leading to profound changes in flora and fauna. At the time of this glacial maximum, the Arctic ice cap covered northern Europe, the glaciers of the Alps descended as far as Lyon, and those of the Pyrenees as far as Arudy ( Pyrénées-Atlantiques). Sea level was around 120 m below present, and the shoreline was pushed ~50 km offshore. In southern Aquitaine, deglaciation of the high Pyrenean mountains must have ended around 15,000 years ago. During the last glacial episode, the Landes was a vast sandy expanse dotted with 'fields of small crescent-shaped dunes of metric height. Beyond the Garonne to the east and the Adour to the south, finer particles ( loess) carried by storms to higher altitudes were deposited to form accumulations on the relief, where steppe vegetation then developed. [7]
Tardiglacial (−19,000 to −11,700 years ago)
The Tardiglacial is the period between the Last Glacial Maximum, which ended around 19,000 years ago, and the beginning of the Holocene, 11,700 years ago, during which there was an irregular rise in temperatures, interspersed with relapses. The beginning of the Tardiglacial period in Europe was marked by the disappearance from our latitudes of certain "archaic" animal species ( mammoths, woolly rhinoceroses, cave bears). Reindeer and horses ( Equus caballus gallicus), sometimes combined with Bovinae (bison or aurochs), became the dominant species of the early Interstadial period, judging by the hunting records of human societies. [9]
The Alleröd (13,900 to 12,900 years ago) is characterized by an increase in tree cover. In the Paris Basin and in Belgium, pollen analyses enable us to distinguish two phases in this episode: the first is characterized by the establishment of an open birch forest (afforestation rate of around 45%); the second, which may be separated by a slight retreat in tree cover, sees the expansion of an open pine-dominated forest. Arctic species are partly replaced by woodland species: aurochs and horses – occasionally present – are joined by deer, roe deer, wild boar, elk and beaver. [10]
Cave paintings can also provide clues to the climate, but these must be interpreted with care. Plants are rare in cavern art, but the animals depicted can help us to understand the climate outside, even if the species depicted on the cave walls represent only a selection. The compositions do not constitute a photograph of the external landscape. The presence of a saiga antelope on a wall in Rouffignac ( Dordogne) betrays cold, dry steppe conditions. The fact that there is only one reindeer and no mammoth depicted at Lascaux may indicate milder temperatures (or perhaps the artists weren't interested in these animals). [11]
The question is: did the artists reproduce images of animals that actually lived in their territory? As Jean-Loïc Le Quellec points out, elephants can be found sculpted on Romanesque churches, even though this pachyderm did not really frequent our forests. The large bulls in the Rotonde de Lascaux are well known, but certain chronological attributions of the cave mean that its decoration began at a time when aurochs (lovers of wooded environments) were not very present in the immediate environment. According to François Djindjian, mammoths had disappeared from the Périgord by the Middle Magdalenian, and were only found further north, in the Loire and Saône basins and in the Paris Basin. Yet Rouffignac was decorated at this time! He therefore proposes that the artists drew them from memory, having gone to contemplate them in a sort of safari avant la lettre. However, new research indicates that mammoths still existed on the banks of the Vézère at this time. Moreover, as Florian Berrouet points out: "The addition of numerous details indicating seasonality or the extreme naturalistic rigor of the artists (anal flap, eye contour, triangular lower lip) and making each animal unique, endowed with a real personality, forces us to believe that man must have rubbed shoulders with, or even observed, these mammoths for a long time." During colder periods, the big beasts migrated in herds southwards, towards hospitable territories. It is perhaps the memory of such a vision that the Magdalenians of Rouffignac immortalized on stone. [11]
-
Bulls on the Lascaux rotunda.
-
Aurochs in the Lascaux cave. Lascaux 2.
-
Mammoth and ibex engraved in the Rouffignac cave.
At the end of the period ( Dryas III), a very severe cold snap led to a return of arctic species, a further retreat of forest and an extension of steppe and tundra landscapes. It ends abruptly with a rapid rise in temperatures. [12] [13]
Climates of the current interglacial period
Temperature changes over the Holocene
The current Holocene interglacial period began some twelve thousand years ago, at the end of the Last Glacial Period (known as the Würm for its Alpine component). [14] In the mountains of Europe, small glaciers also formed in the Vosges, Black Forest, Massif Central, Carpathians, Pyrenees, Apennines, Balkans and Sierra Nevada, as well as in northwest Spain, Crete and Corsica. [15] The deglaciation that preceded it lasted around 10,000 years and resulted in a rise in temperature of around 4 °C and a rise in sea level of around 130 metres. [16]
A study tracing mean annual surface air temperatures across Europe over the last 12,000 years was published in 2003. It is based on quantitative climate reconstructions from over 500 pollen sites assimilated using an innovative four-dimensional gridding procedure. It appears that the Holocene climatic optimum was only observed in northern Europe, and therefore did not affect France. This warming was offset by a mid-Holocene cooling in southern Europe. Trends in mean annual temperatures for the whole of Europe suggest an almost linear increase in the heat budget up to 7800 BC, followed by stable conditions for the rest of the Holocene. This warming at the beginning of the Holocene, followed by an equilibrium, was mainly modulated by rising winter temperatures in the west, which have continued to rise at a progressively decreasing rate to the present day. [17]
Southern Europe and the Mediterranean have experienced almost linear warming since around 8,000 BC. This warming preceded the onset of any major human impact and continued at the same rate until the end of the Holocene, a period of anthropogenic significance. This suggests not only that the Mediterranean climate has an essentially natural origin, but also that the pollen-climate calibration method has remained independent of human impact on vegetation. [17]
The study divides Europe into six parts, delimited in latitude by the 45°N and 55°N parallels and in longitude by the 15°E meridian. France, crossed by the 45°N parallel ( Bordeaux latitude), is represented by two parts: the part north of 45°N is in Central-Western Europe, and the part to the south is in Southwestern Europe. The graphs representing temperature variations in mainland France over the Holocene, reconstructed from pollen data, are shown below [17].
Climatic and cultural sequences throughout the Holocene
In southern France (below latitude 45°N), the climate changed around 8,000 BC. From this date onwards, we can distinguish a phase known as Boreo-Atlantic, which ends with a cold episode, which appears to be worldwide, centered on 6,250 BC. This phase seems to have been marked by a relatively uncertain climate, or at least one of great contrasts. Then, for around half a millennium, we witness the return of an Atlantic ensemble – towards which the sequence preceding this episode was already tending. This is defined by high, very regular rainfall from Spain and North Africa to the Balkans. In addition, average temperatures (and particularly average summer temperatures, the most favorable for vegetation) are said to have been 1.5° to 2 °C higher than in the 1970–1980 period. They may even have exceeded them by 2° to 2.5 °C during what are known as climatic optimum sequences (the first of which occurred around 5700 BC). [18]
Comparing these major climatic sequences with the major cultural sequences may reveal a link between certain sequences. The following table shows such a timeline for Haute-Provence. While the cultural sequences are identical throughout France, the years separating them vary from region to region. This is particularly true of the Neolithic period, when the first groups settled in Provence, Languedoc and Corsica around 5500 BC, but only reached certain other parts of France several hundred years later. [19] [18]
| Major climatic sequences | Great cultural sequences in inland Provence | ||
|---|---|---|---|
| Beginning of our era | Cold, wet sequence (Göschenen I), few thunderstorms but heavy precipitation (including snow at high altitudes) | 750 BC | Iron Age |
| 850 BC | Fairly dry, cool sequence violent thunderstorms, frequent until around 1050/1000 | Bronze Age | |
| 1250 BC | Cold, wet spell (Lobben) – few thunderstorms | ||
| 1450 BC | Fairly dry cool spell, occasionally very violent thunderstorms | ||
| 1850 BC | Very cool and humid sequence frequent violent thunderstorms (Southern Pre-Alps) | 1800 BC
2350 BC |
Chalcolithic |
| 2550 BC | Sub-boreal sequence: gradual drying | Neolithic final | |
| 3200 BC | Cool sequence, severe thunderstorms likely | 3400 BC
3700 BC 4700 BC |
Late Neolithic |
| 3600 BC | Atlantic sequence temperatures warmer than present (1.5 °C-2 °C) climatic optimum around 4900 (2 to 2.5 °C warmer than present. regular, non-violent rainfall). | Middle Neolithic | |
| 5200 BC | Cooler or colder sequence | 5400 BC
6600 BC 8000 BC 9500 BC |
Early Neolithic |
| 5500 BC | Atlantic sequence
climatic optimum around 5700 (2 °C-2.5 °C higher than present, regular and mild precipitation) |
Late Mesolithic | |
| 6100 BC | Cooler, drier period with thunderstorms | Middle Mesolithic | |
| 6300 BC | Boreo-Atlantic sequence
progression of temperatures and precipitation (at least 8000-7000) tending towards an Atlantic character warmer than the present (1.5 °C-2 °CC) with regubliere precipitation, but persistence at least during certain phases of powerful thunderstorms (major fires). |
Middle Mesolithic | |
| 8000 BC | Pre-Boreal
very rapid rise in temperatures at the start (second Great Warming), followed by gradual coolness relatively dry, but periods of heavy rain in some regions (Southern Pre-Alps), perhaps partly of a stormy nature |
Azilian | |
| 9600 BC | Recent Dryas
cold and dry sometimes and very heavy rainfall | ||
Roman climatic optimum (−300 to +200)
The rise of the Roman Empire and viticulture in Gaul
The period between 300 B.C. and A.D. 200 witnessed the development and rise to power of the Roman Empire. This prosperous period is considered socially stable. It corresponds precisely to the period of the Roman Climatic Optimum (RCO), when summers are warm and rather humid. These climatic conditions favored the development of agriculture, as well as the establishment of ornamental gardens. This situation is linked to greater solar activity, linked to the activity of ocean currents, and low volcanic activity. The OCR would therefore have been particularly beneficial to the strong development of viticulture, which expanded in the three Gauls during the 1st. century, reaching as far as southern England. Generally speaking, since agriculture was the Roman Empire's primary source of wealth, it is now clearer that this climatic change was a powerful driving force behind economic development until the 1st. century. [20]
Lyon's development in flood zones
The settlement and development of the city of Lyon in a flood zone benefited from a favorable climatic context linked to the Little Roman Optimum, corresponding to a period of moderate hydrology. A reconstruction of the hydrosedimentary variability of the Rhône at Lyon from 1000 BC to 2000 AD shows the approximate fluctuation of solid and liquid flows over the period. In particular, these curves describe an oscillation during the period between the end of the 1st century BC and the 1st century AD. This was a short period of climatic oscillation, with several episodes of flooding characterized by greater intensity and frequency than in earlier and later periods. The main floods have been dated to the reigns of Augustus, Tiberius and Claudius, between 27 BC and 54 AD. Another climatic oscillation can be seen in the early Middle Ages [21]
This ancient hydrosedimentary crisis within the Roman Petit Optimum can be identified in other areas of Gallia Narbonensis. For example, during the same period, the Saint-Ferréol branch of the Rhône, in the delta, continued to advance. Elsewhere, the port of Narbonne (Narbo Martius) experienced accelerated silting in the 1st century. In Lyon, archaeological digs have shown that the urban society of the city's riverside adapted to this crisis through a series of developments designed to occupy the peninsula between the Rhône and Saône rivers. [21]
Late Antiquity: climatic disasters and the fall of the Roman Empire
The impact of climatic degradation during Late antiquity on the end of the Roman Empire in the West has long been widely discussed in scientific literature. It has been seen as the cause of the great barbarian invasions, of a drop in cereal yields causing famine, of a change in land use, with a conversion of arable land to pasture in Western Europe, and so on. It has also been suggested that the development of rye cultivation in Gaul in late Antiquity was an adaptation of agriculture to the colder climate, which would be an example of resilience. This period of climatic change would thus have affected agricultural production and played a role in historical upheavals, in particular the fall of the Western Roman Empire. But climate was certainly not the sole cause of the fall of the Roman Empire. By the end of the Empire, Roman society was certainly more vulnerable or more exposed to environmental conditions. North American historian Kyle Harper insists on the role of pandemics in the Empire's weakening, due in particular to several periods of plague. [22]
Medieval climatic optimum (900–1300)
The medieval Little Optimum Period (POM) took place in Western Europe between 900 and 1250–1300 AD, with seasons that were slightly milder or warmer, and perhaps drier, than those of the following period. The Little Medieval Optimum may have seen average temperatures of 0.5 °C higher than those of the Little Ice Age that followed, which was itself 0.7 to 0.8 °C lower than those of the end of the 20th century. [23]
Climate zones in mainland France
Worldwide classifications
Latitudinal distribution
Climatologists have drawn up a number of classifications to reflect the diversity of situations on the planet. Overall, they delineate three main zones according to latitude (cold, temperate and hot climates). France is in the temperate zone, characterized by hot summers and moderately cold winters. This classification distinguishes between oceanic (cool summers, mild winters, high precipitation), continental (hot summers, cold winters, low precipitation) and Mediterranean (hot, dry summers, mild winters, autumn precipitation) climates. Within these three climatic zones, a variety of nuances emerge, depending on parameters such as altitude (mountain climate, colder and wetter than in the surrounding plains). [24]
Köppen classification
The Köppen classification is a climate classification based on precipitation and temperature. It was invented in the 1920s by botanist Wladimir Peter Köppen, who combined the world vegetation map published in 1866 by Hermann Griesbach and the division of climate into five zones by de Candolle. [25] A climate is thus identified by a two- or three-letter code. This is the most common climatic classification, in the version presented by Rudolf Geiger in 1961. The Köppen-Geiger map remains a reference today, thanks to its frequent updates, in the fields of hydrology, geography, agriculture, biology and climatology through its research into the evolution of climates.
A large part of mainland France lies in the oceanic domain (Cfb), while the plains and hills bordering the Mediterranean basin have a climate designated by Csa.
Eco-climatic classifications
Les paramètres climatiques permettent de prévoir le type de végétation dans une zone, de la même manière l'examen d'une flore permet d'en déduire le climat. Le PNUD et le WWF usent ces critères bioclimatiques pour définir des écozones. Ce type de classification décrit des biomes et non-pas strictement des climats, le climat se déduisant du biome. En vert, les forêts tempérées décidues et mixtes; en marron, les Forêts, terres boisées et broussailles méditerranéennes
-
Köppen-Geiger classification of France based on 1980-2016 data.
-
WWF classification, differentiating 14 terrestrial biomes (two for France).
National typologies
8 types of climate (Joly et al. – 2010)
A 2010 study by Daniel Joly, Thierry Brossard, Hervé Cardot, Jean Cavailhes, Mohamed Hilal and Pierre Wavresky classified metropolitan France's climates into eight major types. Based on station measurements of precipitation and temperature provided by Météo-France, a set of 14 variables incorporating a 30-year time series (1971–2000) was defined to characterize climates and their distinctive modes of variation. An original method known as local interpolation was used to reconstitute the continuous spatial fields of the variables in question, and to express them in the form of information layers manageable by GIS. The result is 8 types of climate [26]
- Type 1 (blue): mountain climates include all areas where mountain and/or semi-continental influences predominate, with a high number of days and a high accumulation of precipitation, an average temperature below 9.4 °C and, correlatively, more than 25 days with a minimum temperature below −5 °C and fewer than 4 with a maximum above 30 °C. [27]
- Type 2 (light-blue): semi-continental climate and climate of the mountain margins include the mountain peripheries and extend over vast areas where temperatures are less cold than in the mountains (although, at equal altitude, they are colder than anywhere else), precipitation is slightly lower and less frequent, but climatic variability over the 1971–2000 normal is just as high. [28]
- Type 3 (turquoise): The degraded oceanic climate of the central and northern plains remains oceanic, but with some fine gradations. Temperatures are intermediate (around 11 °C annual average, between 8 and 14 days with temperatures below −5 °C). Precipitation is low (less than 700 mm annual total), especially in summer, but rainfall averages 12 days in January and 8 in July, which are average values for France as a whole. [29]
- Type 4 (pale green): The altered oceanic climate represents a transition between the frank oceanic (type 5) and the degraded oceanic (type 3). The average annual temperature is fairly high (12.5 °C), with a low number of cold days (between 4 and 8 per year) and a high number of hot days (between 15 and 23 per year). The annual temperature range (July–January) is close to the minimum, and interannual variability is average. Precipitation, average yearly (800–900 mm), falls mainly in winter, while summer is fairly dry. [30]
- Type 5 (dark green): Oceanic climate. Temperatures are average and very homothermic: annual amplitude (less than 13 °C difference between July and January), number of cold days (less than 4) and hot days (less than 4) and interannual variability are minimal. Precipitation is abundant every year (just over 1,000 mm) and frequent in winter (over 13 days in January). Summer is also rainy (8–9 days in July), but rainfall totals are low. [31]
- Type 6 (vivid green): Altered Mediterranean climate. The average annual temperature is high, with a small number of cold days and hot days ranging from 15 to 23/year. Interannual variability in July temperatures is minimal: summer is repeatedly hot from one year to the next. Annual precipitation is average (800–950 mm), but not evenly distributed. [32]
- Type 7 (orange): The climate of the Southwest Basin is characterized by high mean annual temperatures (above 13 °C) and a high number (> 23) of warm days, while days with frost below −5 °C are rare. The annual thermal amplitude is high (15 to 16 °C) and the interannual variability of winter and summer temperatures is low. Precipitation, which is not very abundant (less than 800 mm) in winter, is slightly more abundant in summer. It is more frequent in winter (9-11 days) than in summer (less than 6 days). [33]
- Type 8 (yellow): The frank Mediterranean climate. The climatic characteristics are very clear-cut, more so than in any of the previous seven climates. Annual temperatures are high, with rare cold days and frequent hot days. The inter-annual amplitude is high (over 17 °C between July and January), while these characteristics are very stable from one year to the next. The very high ratio of autumn to summer precipitation (> 6) is the main characteristic of this climate. Cumulative annual precipitation is low, with an arid summer but a fairly well-watered winter despite a low number of rainy days. [34]
5 types of climate (Météo-France – 2022)
Climate characterization has also been the subject of various types of representation, notably umbrothermal diagrams (climatograms, climograms or climate maps). These graphical representations show precipitation and temperature for each month of the year. The etymology of the word ombrothermique is in fact linked to the Greek ombros (storm rain) and thermique (relating to heat, temperature). The temperatures and precipitation used in these diagrams correspond to average monthly data for a given location, recorded over thirty years. This type of visual representation makes it possible to compare the temperature and precipitation of different climates in relation to each other. For example, the French territory is made up of several climates: oceanic (Brest), altered oceanic (Cambrai), semi-continental (Lons-le-Saunier), Mediterranean (Marseille) and mountain (Chamonix Mont-Blanc). [24]
The map of these five major climate types in mainland France published by Météo-France in 2022, together with the characterization of these climates and the representative umbrothermal diagrams, are as follows [35]
- Type 1. The oceanic climate is characterized by mild temperatures and relatively abundant rainfall (due to disturbances from the Atlantic), distributed throughout the year, with a slight maximum from October to February. The city of Brest is representative of this climate. [36] [37] [38]
-
Climate normals 1971-2000
-
Climate normal 1981-2010
-
Climate normals 1991-2020
- Type 2. The altered oceanic climate is a transition zone between the oceanic climate and the mountain and semi-continental climates. Temperature differences between winter and summer increase with distance from the sea. Rainfall is lower than at the seaside, except in the vicinity of relief. The towns of Orléans [39] [40] [41] and Cambrai are typical of this climate. [42] [43] [44]
-
Climate normals 1971-2020
-
Climate normal 1981-2020
-
Climate normals 1991-2020
-
Climate normals 1971-2020
-
Climate normal 1981-2020
-
Climate normals 1991-2020
Type 3. Semi-continental climate. Summers are hot and winters harsh, with many days of snow or frost. Annual rainfall is relatively high, except in Alsace, which benefits from the protective effect of the Vosges mountains (föhn effect). Rainfall is heaviest in summer, often with thunderstorms. The city of Besançon is representative of this climate [45] [46] [47]
-
Climate normals 1971-2000
-
Climate normal 1981-2010
-
Climate normals 1991-2020
Type 4. Mountain climate. Temperature decreases rapidly with altitude. There is minimal cloud cover in winter and maximum in summer. Winds and precipitation vary considerably according to location. The town of Bourg-Saint-Maurice (altitude: 865 m) is representative of this climate. [48] [49] [50]
-
Climate normals 1971-2000
-
Climate normal 1981-2010
-
Climate normals 1991-2020
Type 5. The Mediterranean climate is characterized by mild winters and hot summers, plenty of sunshine and frequent strong winds. There are few rainy days, irregularly distributed over the year. Dry winters and summers are followed by very wet springs and autumns, often in the form of thunderstorms (40% of the annual total in 3 months). In just a few hours, this precipitation can bring 4 times more water than the monthly average to a given location, particularly near the relief (Mediterranean episode). The city of Marseille is representative of this climate.
[51]
[52]
[53]
-
Climate normal 1971-2020
-
Climate normal 1981-2020
-
Climate normals 1991-2020
29 climate regions (Météo-France – 2020)
In 2020, Météo-France is also publishing a map showing a breakdown into 29 climatic regions, taking into account the many factors that can influence climate on a regional scale, such as latitude, altitude, distance from the sea or major mountain ranges, etc. [54]
|
Microclimates
Overseas France
Overseas France, with its widely scattered territories, has a wide variety of climates.
Saint-Pierre and Miquelon
Saint-Pierre and Miquelon has a cold, humid oceanic climate. According to Köppen's classification, Saint-Pierre and Miquelon is in category Dfb ( humid continental climate) / Dfc ( subarctic climate with no dry season).
To the east of the large North American continental landmass, the climate is strongly influenced by it. Prevailing westerly quadrant winds originating on the continent come into contact with the ocean, often resulting in significant temperature contrasts. In winter, these winds are very cold and come into contact with milder oceanic air masses, creating or activating vigorous disturbances that generate intense snowfalls and sharp temperature drops. In summer, the flow is slightly different: warm and sometimes humid continental air masses from the Gulf of Mexico, upwelling via the American continent, come into contact with cold ocean waters (cold polar downwelling, also known as the " Labrador Current"), often resulting in thick, tenacious fog. The air is stabilized by the cold water, and rainfall is lower at this time of year.
This is a semi-continental climate, with fairly cold winters (average February temperature of −3.5 °C in Saint Pierre), though milder than on the American mainland, and very cool summers (15.5 °C in Saint Pierre in August, cooler than in mainland France at the same latitude) due to the presence of cold oceanic water. At the heart of this clash of air masses with very different characteristics, rainfall is abundant (1,312 mm per year in Saint-Pierre), with a winter maximum.
French West Indies (Guadeloupe, Saint-Martin, Saint-Barthélemy, Martinique), Reunion Island, Indian Ocean islands (Îles Éparses), Mayotte, New Caledonia, French Polynesia, Wallis and Futuna.
These islands, whose latitude extends a little beyond the Tropics (Rapa 27° 37′ S) and less than ten degrees towards the equator (Hiva-Oa 9° 49′ S), are located in the flow of the trade winds that blow regularly at these latitudes. These disturbances are moderate during the dry season, which corresponds to the winter at higher latitudes, and much more frequent and abundant during the summer and especially autumn periods of the year, as a result of the higher ocean temperatures at this time and the growing instability due to the proximity of the ITCZ (Inter-Tropical Convergence Zone), which rises in latitude in the summer hemisphere. There is a clear contrast between the "windward" slope exposed to the trade winds, which receives between 1,500 and 2,500 mm of rain annually (up to 4,634 mm annually at Plaine des Palmistes in La Réunion, at an altitude of 1,032 m), and the "leeward" slope (980 mm annually at Koumac in New Caledonia), which is much drier and even arid in places. The months with the least rainfall have between 30 and 90 mm (the dry season is relative), while the months with the most rainfall have between 200 and 400 mm.
In addition to the upsurge in rainfall in late summer/autumn, these islands are exposed to devastating tropical cyclones at this time of year, both in terms of the amount of rain dumped in a few hours and the stormy winds associated with them.
Due to the oceanic environment and low latitude, annual averages are high (Ile des Pins 22.5 °C, Saint Denis 24 °C, Le Lamentin 26.2 °C) and temperature differences are not very marked in these regions. Differences from one day to the next and from one season to the next are not very marked. The annual amplitude increases slightly as you move away from the equator, ranging from 1.9 °C in Hiva-Oa to 6.3 °C in Rapa, further away from the equator, via 3.1 °C in Pointe à Pitre. Differences between seasons are much more due to differences in rainfall than to differences in temperature.
Unlike temperate zones, the mountains in these regions have a higher annual amplitude than low-lying areas.
These islands have a tropical climate.
French Guiana
French Guiana has a humid equatorial climate. Close to the equator, French Guiana is characterized by high temperatures all year round (annual average 26.3 °C in Cayenne and 26.5 °C in Saint-Laurent), with very little difference from one month to the next (less than 2 °C difference between the warmest and warmest months in Cayenne and Saint-Laurent), and very abundant rainfall (3,674 mm per year in Cayenne, 2,595 mm per year in Saint-Laurent) spread over almost every month of the year. In Cayenne, only the months of September and October have less than 150 mm of rainfall (75 and 80 mm respectively), and some months have rainfall close to 500 mm (May or June). In Saint-Laurent, with its more uniform rainfall pattern, all months have more than 100 mm, with September and October being the least rainy and the only two months with less than 150 mm, and the wettest months totalling around 400 mm. Permanently bathed in equatorial air, with little seasonal variation, the temperature records are only slightly accentuated: 17.5 °C and 36.4 °C in Saint-Laurent. Close to the equator, French Guiana is not visited by cyclones.
Saint-Paul and New Amsterdam
The latitude of these islands means they are permanently swept by the intense westerly flow of the southern hemisphere. However, being relatively far from the pole (between 37° S and 39° S), their climate is not too cold, with an annual average of 14.1 °C in New Amsterdam. Bathed by an immense ocean, whose waters are stirred up by disturbances, these regions experience a fairly small amplitude between winter and summer. The climate is windy, with a temperate summer (average February temperature of 17.6 °C at Saint-Martin-de-Viviès in New Amsterdam) for the latitude, and a mild winter (average August temperature of 11.5 °C at New Amsterdam). Frost is unknown.
These islands are affected by regular, vigorous storms, and enjoy abundant rainfall (around 1,100 mm/year) throughout the year, with a marked increase in autumn and early winter (April to August). Summer (November to March) is calmer and less rainy as the tropical anticyclone moves up in latitude. The extremes are 72 mm in February and 119 mm in June.
Crozet and Kerguelen
These islands, like the previous ones, are permanently swept by the intense circumpolar westerly flow in the immense southern hemisphere ocean. However, closer to the pole, their climate is even windier and much colder. Well supplied with polar air by the very cold Antarctic continent, disturbances are vigorous and frequent, windy and with little respite from one season to the next, generating rainfall evenly distributed throughout the year, moderately abundant at Port-aux-Français (800 mm/year) in a sheltered position on the east coast, much more intense on the west coast.
Because the environment is even more turbulent than in the previous area, the temperature range between winter and summer is very small for the latitude, around 6 °C (between 8 and 45 °C in the northern hemisphere at the same latitudes). Apart from the wind, winter is relatively mild, with an average temperature of 2.2 °C in August in Port-aux-Français, while summer is very cool, with an average of 8.3 °C in February in Port-aux-Français, already polar despite the latitude (between 46° S and 49° S). It can freeze almost every month on Kerguelen and 10 months out of 12 on Crozet, but records (cold or hot) are not very marked (absolute extremes −8.6 °C and 25.8 °C on Port-aux-Français).
Adélie Land
A narrow sector of the enormous Antarctic ice mass, Adélie Land has an extreme polar climate, within the coldest continent on earth, with a very low average winter temperature (−16.5 °C in July at Dumont d'Urville, which is relatively cooler because it's by the sea, but can approach −70 °C in the heart of the continent) and a consistently negative average summer temperature, even along the coast (−0.8 °C in January at Dumont d'Urville, but around −20/-30 °C inland). In winter, intense cooling is caused by permanent night-time conditions over a continental mass centered on the pole and relatively isolated from thaw by the vigorous westerly flow that prevails in the southern hemisphere's mid-latitudes. In summer, the permanent sunshine is unable to warm these regions, due to the thermal inertia of the enormous glacial mass, the persistent snow cover with its high albedo, and the cold ocean mass surrounding the continent.
This is the domain of the very violent katabatic wind that blows from the interior of the continent towards the coast, caused by the descent of the icy air that forms on the summit of the Antarctic Plateau (over 3,000 m) towards sea level. Through adiabatic compression, however, this air "warms up" considerably during this journey, reaching the ocean much less cold than it was in the interior of the continent (record cold of −37 °C at Dumont d'Urville, which is "mild" compared with the −90 °C sometimes reached in winter in the heart of Antarctica).
The wind is also caused by disturbances circulating around the edge of the continent.
Precipitation, although not measured, is estimated to be fairly low in this permanently icy environment, as the cold is not conducive to it.
Climate parameters
Observation and data collection systems
Contemporary classifications are based on objective measurements of measurable parameters at the origin of climate: temperature, humidity, hydrometry, rainfall, sunshine, wind speed, etc.; and on statistical analysis. Indices derived from these measurements can be created, such as the aridity index and evapotranspiration. These objective measurements are supplemented by more empirical assessments, such as Köppen's classification, designed to match climatic zones with biomes.
Observation systems were set up as early as the Age of Enlightenment, on the initiative of learned societies. Systematic operational practice followed in the 19th century, with the creation of meteorological services in several countries. In 1854, the maritime disaster in the Crimea led to the creation of observation and warning services in France and Great Britain. In 1856, 24 measuring points manned by employees of the telegraph administration were in operation in France: they formed the telegraphic meteorological network of the Paris Observatory, which began publishing its International Bulletin [55] daily in November 1857. In 2014, France was covered by a dense network of more than 5,500 weather stations, with an average of 1 station every 11 km, recording actual field observations of climatic parameters such as temperature, precipitation, wind and humidity. These data are generally controlled and validated to limit bias. [56]
Climate models
Climate models play a key role in estimating past and future climate variations. They rely on the laws of fluid mechanics to numerically reconstruct the main features of atmospheric and/or ocean dynamics. The first global atmospheric models were developed using a grid resolution of around 500 kilometers, and by the 1970s it was already possible to describe the main features of atmospheric circulation using numerical. [57] Climate models differ from one another in terms of their objectives, their resolution, the temporality of the spatialized data and the climate data provided.
Aurelhy model (Météo-France)
The Aurelhy (Analyse Utilisant le RELief pour l'HYdrométéorologie) model, developed by Météo-France, provides 30-year normals (1951–1980; 1961–1990; 1971–2000; 1981–2010; 1991–2020) and annual statistics for temperature and precipitation parameters. When the Aurelhy normals for the 1981–2010 period were updated, an important development was the use of a new digital terrain model and better consideration of the quality of measurement stations. The 1991–2020 normals were published in June 2022. [58] Mesh resolution is one kilometer. [57] [59]
ETPQ model (Météo-France)
The ETPQ (Daily Potential Evapotranspiration) model was built to meet the need for real-time monitoring of potential evapotranspiration over the whole country by users in the agronomy sector. Six climatic parameters are used, including global radiation, temperature, humidity and wind speed. The grid resolution is twelve kilometers. [57]
Safran model (Météo-France)
The Safran model (Système d'Analyse Fournissant des Renseignements Atmosphériques à la Neige) is an analysis of atmospheric data (by analysis we mean an estimate of recent or present conditions, depending on the time step considered) built during the 1990s by Météo-France. At the time, its aim was to forecast avalanche risk in mountain areas (hence its name) by providing data on an hourly time step. The model is based on a division of the French national territory into 615 climatically homogeneous regions. These regions are irregular in shape, and normally cover an area of less than 1,000 km2. In each homogeneous region, Safran then estimates the variation in 8 climatic parameters by 300 m altitude class, based on all available climate data (weather stations, but also analyses of large-scale weather forecasting models such as Météo-France's ARPEGE model). The mesh resolution is eight kilometers. [57]
Digitalis model (AgroParisTech)
The Digitalis model, developed by AgroParisTech in Nancy, involves modeling the climatic parameters required to calculate the water balance: solar radiation, average temperatures at the top of the forest canopy, precipitation and evapotranspiration according to Turc's formula. Evapotranspiration and temperature are spatialized at 50 m intervals, based on the IGN digital terrain model (DTM), and therefore take into account the topo climate at a resolution level fin [57]
Arpège model (CNRM-CE)
The ARPEGE-Climat model, developed in the 1990s, is the climate version of the ARPEGE numerical model, a global and spectral general circulation model developed by the Centre national de recherches météorologiques in collaboration with the European Centre for Medium-Range Weather Forecasts (ECMWF). The ARPEGE grid can be tilted to change the pole position and stretched to increase resolution in an area of interest, enabling regional studies to be developed. [60] [61] The operational short-range ensemble forecasting system, known as PEARP (Prévision d'Ensemble ARPege), is also based on the Arpège model. This system aims to capture and quantify the uncertainty inherent in any weather forecast. Its horizontal resolution is around 7.5 km over France, and 36 km in the antipodes. [62]
Arome model (Météo-France)
The AROME model, operational since 2008, is the fine-mesh numerical weather prediction model used operationally by Météo-France to improve short-term forecasting of dangerous phenomena such as heavy Mediterranean rainfall (Cévennes episodes), violent thunderstorms, fog or urban heat islands during heatwaves. [63]
Other models (IPSL)
The Institut Pierre-Simon Laplace (IPSL) is a federation of research laboratories dedicated to the study of the climate system and the global environment. Since 1995, the IPSL Climate Modeling Center (IPSL-CMC) has been developing and using climate models to improve our understanding and knowledge of the climate system, its current characteristics and its past and future changes. IPSL's Earth System Model (ESM) represents the various components of the climate system and their interactions. It includes the LMDz model for the atmosphere, the INCA and REPROBUS models for atmospheric composition, the NEMO model for the ocean, including ocean dynamics (NEMO-OCE), sea ice (NEMO-LIM) and ocean biogeochemistry (NEMO-PISCES), and the ORCHIDEE model for land surfaces. A new dynamical core for the atmosphere, known as DYNAMICO, is now coupled to atmospheric physics and constitutes a new-generation model. [64] The Laboratoire de météorologie dynamique (LMD), set up in 1968, is one of the laboratories working on these models and on models of its own, notably the LMDZ, an atmospheric general circulation model developed since the 1970s. [65]
Temperatures
Climate normals, calculated over 30 years, are used to characterize the climate at a given location, for a given period. Normals are calculated for all climate variables (temperature, precipitation, wind, sunshine, etc.), as well as for numerous indicators illustrating the statistical distribution of these parameters: average, quintiles (what happens one year in five), records, number of days above a threshold, etc. [66]
Average temperature
| Year | Anual
Average |
January | February | March | April | May | June | July | August | September | October | November | Decemember |
|---|---|---|---|---|---|---|---|---|---|---|---|---|---|
| 2024 | 6.1 | ||||||||||||
| 2023 | 14.4 | 6.3 | 6.9 | 10.2 | 11.8 | 16.2 | 21.5 | 21.9 | 22.0 | 21.1 | 16.4 | 10.1 | 8.0 |
| 2022 | 14.5 | 5.0 | 8.1 | 9.9 | 11.8 | 17.8 | 21.2 | 23.2 | 23.7 | 18.2 | 17.2 | 10.9 | 6.7 |
| 2021 | 12.9 | 4.9 | 8.2 | 8.9 | 10.4 | 13.8 | 20.3 | 20.7 | 20.0 | 19.3 | 13.5 | 77.9 | 6.9 |
| 2020 | 14.1 | 7.1 | 9.3 | 9.4 | 14.1 | 16.5 | 18.6 | 21.6 | 22.6 | 19.0 | 13.0 | 10.5 | 6.9 |
| 2019 | 13.7 | 4.6 | 8.0 | 10.1 | 11.7 | 13.9 | 20.1 | 23.0 | 21.8 | 18.5 | 15.1 | 8.8 | 8.1 |
| 2018 | 13.9 | 8.4 | 3.5 | 8.2 | 13.8 | 16.3 | 20.1 | 23.2 | 22.3 | 19.0 | 14.4 | 9.6 | 7.7 |
| 2017 | 13.4 | 3.1 | 8.2 | 11.0 | 11.4 | 16.5 | 21.2 | 21.7 | 21.5 | 16.4 | 14.9 | 8.2 | 5.9 |
| 2016 | 13.1 | 7.1 | 7.3 | 8.0 | 11.1 | 15.0 | 18.7 | 21.3 | 21.5 | 19.7 | 12.6 | 8.8 | 5.6 |
| 2015 | 13.6 | 5.6 | 4.9 | 9.1 | 12.6 | 15.5 | 19.8 | 22.8 | 21.6 | 16.4 | 12.7 | 11.2 | 9.5 |
| 2014 | 13.8 | 7.6 | 7.9 | 9.8 | 13.0 | 14.7 | 19.6 | 20.6 | 19.1 | 18.9 | 15.9 | 11.3 | 6.3 |
↓ Climate normals (°C) ↓
| |||||||||||||
| 1991–2020 | 13.0 | 5.4 | 6.1 | 9.1 | 11.8 | 15.4 | 18.9 | 21.1 | 21.1 | 17.5 | 13.1 | 9.0 | 6.1 |
| 1981–2010 | 12.6 | 5.0 | 5.7 | 8.7 | 11.1 | 15.0 | 18.3 | 20.8 | 20.6 | 17.3 | 13.5 | 8.5 | 5.6 |
| 1971–2000 | 12.2 | ||||||||||||
| 1961–1990 | 11.8 | ||||||||||||
| 1951–1980 | 11.6 | ||||||||||||
Metropolitan France
Temperatures in mainland France are on the rise. Warming is between +0.19 °C and +0.40 °C per decade for the minimum temperature (Tn) and between +0.22 °C and +0.45 °C per decade for the maximum temperature (Tx) for metropolitan France. These trends are all statistically significant, and are associated with an uncertainty of around ±0.1 °C per decade. On average, over all available series, warming is +0.29 °C per decade for Tn and +0.32 °C per decade for Tx. However, this difference in trend between Tn and Tx (0.03 °C) is not significant. [67]
Average temperature (Tm) is defined as the average of minimum and maximum temperatures. Tm series show significant trends, ranging from +0.21 °C to +0.39 °C per decade. Consistent with Tn and Tx, the average trend is +0.31 °C per decade, and there are no significant spatial contrasts between the different regions. [67]
The map on the right shows the 1981–2010 temperature normals spatialized on a grid of kilometric resolution. [68]
Overseas
A similar trend can be observed in the French overseas departments. In French Guiana, for example, the increase is in the order of 0.24 degrees per decade over the period 1955–2009. Warming has accelerated in recent decades. The increase in mean annual temperature reached 0.34 degrees per decade over the period 1979–2005. In Martinique, the increase was around 0.28 degrees per decade over the period 1965–2009. Warming reached 0.33 degrees per decade over the period 1979–2005. [67]
Precipitation
Annual characteristics
Average annual precipitation totals for mainland France have been relatively stable since the 1970s (932 mm for 1971–2000, 935 mm for 1981–2010, 935 mm for 1991–2020). However, this observation masks major seasonal and regional disparities, as follows Meteo France, Sénat:
- In winter, there was a slight increase in rainfall in the northern half of the country, and a marked drop in the southern half.
- in spring, rainfall fell sharply in the south-eastern quarter of the country, but rose sharply elsewhere (particularly in the north-eastern quarter).
- in summer, there is a slight increase in rainfall over much of the northern half of the country, and a drop in the southern half, which is particularly marked around the Mediterranean.
- in autumn, there is a clear increase in precipitation in the Massif Central and the East, and a slight drop elsewhere, with a more pronounced fall around the Mediterranean.
The range of average annual precipitation is very broad, from less than 600 mm in the eastern half of the Eure-et-Loir, the Rhône delta and the Aude valley, to over 2000 mm in the Cantal mountains, Mount Aigoual and the Chartreuse. Precipitation remained below 800 mm throughout the Paris Basin. [69]
Heavy rain in mainland France
The regions of France most exposed to torrential downpours that can bring more than 200 mm (and in some cases considerably more) in a single day are those bordering the Mediterranean. In some cases, these amounts are recorded in just a few hours. The departments of Ardèche, Gard and Hérault are the most exposed to torrential downpours. In 50 years, there have been more than 50 occurrences of more than 200 mm in 1 day at at least one measuring point in the department. In other words, this type of rainfall occurs on average at least once a year. Among the most remarkable "Cevennes" episodes in south-eastern France, those recording more than 200 mm per day for 2 consecutive days occurred on 17 and 18 December 1997, 11 and 12 November 1996, 3 and 4 November 1994, 7 and 8 November 1982, 31 October and November1, 1968, 24 and 25 September 1965, and 30 and 31 October 1963. [70] These extreme daily rains are becoming increasingly intense around the Mediterranean. They are also characterized by great variability from one year to the next. [67]
Climatic parameters for 30 cities
The table below shows the main climatic parameters for the period 1991–2020 for the 30 stations used to calculate the national heat indicator. [71]
| Stations | Temperatures | Sunshine | Precipitation | |||||
|---|---|---|---|---|---|---|---|---|
| average | average max | extreme mini | Cumulative
average |
Max
in 24 h |
Max
in 5 d |
Avg > 1 mm | ||
| Agen [72] | 13.8 | 41.0 (1 August 1947) | −211.9 (15 February 1956) | 2019.9 | 708.2 | 198.9 (Nov 9th,1968) | 223.3 (Nov) | 6.1 |
| Bastia [73] | 16.3 | 38.3 (20 August 1988) | −5.0 (16 February 1956) | 2645 | 816.9 | 511.0 (16 July 1993) | 511.0 (July) | 10.8 |
| Besançon [74] | 11.4 | 40.3 (28 July 1921) | −20.7 (9 January 1987) | 1872.8 | 1157.0 | 117.1 (3 October 1935) | 211.0 (Aug) | 8.0 |
| Bordeaux [75] | 14.2 | 41.2 (23 July 2019) | −16.4 (Jan 16th,1985) | 2069.9 | 924.9 | 137.9 (25 September 1982) | 176.0 (sept) | 7.0 |
| Bourg-Saint-Maurice [76] | 10.5 | 38.4 (31 July. 1983) | −21.3 (6 January 1985) | 2008.9 | 975.6 | 101.2 (21 December 1991) | 186.9 (Feb) | 8.1 |
| Brest, France [77] | 11.7 | 39.3 (18 July 2022) | −14.0 (28 January 1947) | 1554.7 | 1229.8 | 82.6 (24 October 2011) | 138.1 (Jan) | 6.9 |
| Caen [78] | 11.5 | 40.1 (July 18th,2022) | −19.6 (8 January 1985) | 1746.2 | 740.3 | 183.9 (19 August 1996) | 189.4 (Ago) | 5.4 |
| Châteauroux [79] | 12.1 | 41.1 (July 25th,2019) | −22.8 (16 July 1985) | 1831.5 | 728.6 | 67.6 (4 June 2002) | 106.2 (Sept) | 6.2 |
| Clermont-Ferrand [80] | 12.1 | 40.9 (26 June 2019) | −29.0 (14 February 1929) | 1957.8 | 563.4 | 98.0 (5 June 1986) | 148.1 (Feb) | 5.7 |
| Cognac, France [81] | 13.7 | 40.3 (23 July 2019) | −19h.4 (15 February 1929) | 2042.8 | 771.8 | 116.1 (7 Apr 1986) | 152.1 (Apr) | 6.0 |
| Dijon [82] | 11.4 | 39.5 (23 July 2019) | −22.0 (15 February 1929) | 1890.1 | 743.4 | 110.1 (9 June 1953) | 226.5 (Nov) | 6.2 |
| Le Mans [83] | 12.4 | 41.1 (July 25th,2019) | −21.0 (29 December 1964) | 1808.6 | 693.4 | 85.30 (31 May 2008) | 113.0 (Jan) | 5.6 |
| Lille [84] | 11.3 | 41.5 (25 July 2019) | – 19.5 (14 January 1982) | 1627.5 | 740.0 | 62.8 (19 August 2005) | 107.6 (July) | 5.4 |
| Lyon [85] | 13.1 | 40.5 (July 25th,2019) | −24.6 (22 December 1938) | 2049.5 | 820.8 | 105.9 (May | 172.2 (Oct) | 8.2 |
| Marseille [86] | 15.9 | 39.7 (July 26th,1983) | −16.8 (12 February 1956) | 2897.6 | 532.3 | 212.3 (18 September 1932) | 212.4 (Sept) | 9.0 |
| Montélimar [87] | 14.2 | 41.1 (13 August 2003) | −17.2 (22 December 1938) | 2441.2 | 919.5 | 218.4 (26 September 1999) | 258.5 (Sept) | 10.4 |
| Nancy, France [88] | 11.0 | 40.1 (24 July 2019) | −24.8 (21 February 1956) | 1708.4 | 746.3 | 103.0 (21 May 2012) | 133.8 (May) | 5.6 |
| Nantes [89] | 12.7 | 42.0 (18 July 2022) | −15.6 (15 February 1956) | 1908.6 | 819.5 | 96.7 (2 October 2021) | 100.0 (Sept) | 6.0 |
| Nevers [90] | 11.4 | 39.4 (31 July 2020) | −25.0 (9 January 1985) | 1843.9 | 783.5 | 77.0 (Aug 28th,1983) | 320.1 (Dec) | 10.6 |
| Nice [91] | 16.3 | 37.7 (1 August 2006) | −7.2 (9 January 1985) | 2760.8 | 791.3 | 237.0 (18 December 1983) | 320.1 (Dec) | 10.6 |
| Nîmes [92] | 15.6 | 44.4 (28 June 2019) | −14.0 (23 February 1948) | 2679.9 | 734.4 | 266.8 (12 October 1990) | 329.4 (Sept) | 10.3 |
| Orléans [93] | 11.7 | 41.3 (July 25th,2019) | −19.8 (25 January 1940) | 1822.8 | 635.5 | 64.4 (15 July 1958) | 147.7 (July) | 5.3 |
| Parc Montsouris [94] | 12.8 | 42.6 (25 July 2019) | −23.9 (10 December 1879) | 1717.11 | 634.3 | 104.2 (July 6th,2001) | 112.4 7(July) | 5.6 |
| Pau, Pyrénées-Atlantiques [95] | 13.7 | 39.9 (1 August 1947) | −15.0 (13 February 1956) | 1909.7 | 1093.8 | 91.3 (June 12th,2018) | 161.8 (Dec) | 7.9 |
| Perpignan [96] | 16.0 | 42.4 (28 June 2019) | −11.0 (10 February 1956) | 2488.7 | 578.3 | 222.0 (12 November 1999) | 352.9 (Dec) | 9.3 |
| Poitiers [97] | 12.2 | 40.8 (27 July 1947) | −11.0 (10 February 1956) | 1940.7 | 695.3 | 92.3 (2 February 2011) | 116.0 (Nov) | 6.0 |
| Reims [98] | 11.3 | 41.1 (25 July 2019) | −12.8 (Jan 18th,2013) | 1919.6 | 559.7 | 71.4 (22 July 2016) | 96.7 (July) | 4.9 |
| Rennes [99] | 12.4 | 40.5 (18 July 2022) | −19.0 (14 February 1929) | 1761.6 | 691.0 | 80.6 (15 May 1971) | 104.4 (Jun) | 5.7 |
| Strasbourg [100] | 11.4 | 38.9 (25 July 2019) | −23.6 (23 January 1942) | 1747.3 | 635.7 | 66.3 (20 July 2014) | 121.6 (Sept) | 5.4 |
| Toulouse [101] | 14.2 | 40.7 (4 August 2003) | −19.2 (15 February 1956) | 2075.1 | 627.0 | 82.7 (7 July 1977) | 140.5 (Sept) | 6.4 |
Records
The highest temperature recorded by Météo-France in metropolitane France was 46.0 °C, measured in Vérargues, Hérault, on 28 June 2019, making France the sixth-highest-temperature country in Europe. [102]
The lowest temperature recorded by Météo France in mainland France was −36.7 °C, measured at Mouthe in Doubs on 13 January 1968. [103]
Precipitation records are set during Mediterranean episodes, some of which exceed 600 mm of rain per 24 hours. [104] For example, the 1940 aiguat reached 840 mm in 24 hours, the European record for rainfall intensity, [105] and extreme events of over 600 mm per 24 hours were recorded in 1827 in the Ardèche, in 1900 in the Gard, in 1982 in the Pyrénées-Orientales, in 1993 in Corsica, in 1999 in the Corbières and in 2002 in the Gard. [104]
Mount Aigoual (1,565 meters above sea level) in the Gard region of France holds the record for average annual precipitation, with 2,280 mm per year, and for the highest total annual precipitation, with 4,014 mm in 1913. [106]
The year 2022 is the hottest ever recorded in the country. [107]
In August 2023, records were set at a large number of stations: 43.2 °C at Carcassonne, 42.4 °C at Toulouse, 30.4 °C at Mont Aigoual. [108]
Meteorological overview
Meteorology is a science with a much shorter time scale than climatology. Its aim is to study atmospheric phenomena such as clouds, precipitation and wind, to understand how they form and evolve as a function of measured parameters such as pressure, temperature and humidity. An overview of some meteorological situations and phenomena is given below.
Typical weather situations in mainland France
The most frequent weather situations and associated weather types in mainland France are as follows: [109]
- Anticyclonic conditions: an anticyclone (often the Azores High) is centered over mainland France, pushing disturbances further north towards the British Isles. High-pressure conditions are synonymous with calm, generally dry weather.
- Disturbed westerly flow: this is generated by an area of low pressure associated with cold air aloft over the North Atlantic, and by the Azores anticyclone accompanied by warm subtropical air aloft. Between these two centers of action, the more or less rapid flow circulates from west to east over the Atlantic.
- South to south-westerly flow: The establishment of such a flow brings air masses of subtropical origin, laden with moisture and heat. In winter, this flow brings mildness and rain, while in summer it generates instability in the form of thunderstorms.
- North to northwest flow: when a low-pressure system is positioned or forms in the North Sea. This situation occurs fairly frequently in spring, autumn and winter
- Eastward flow, or blocking: disturbances affecting France generally move from west to east. However, in a few special cases, atmospheric circulation is reversed and disturbances affect the country from the east: this is known as an easterly return. This situation arises when high pressure is located at more northerly latitudes than usual. This prevents the circulation of conventional oceanic disturbances over Western Europe, which have no choice but to bypass this very northerly anticyclone and return to our country from the east. This configuration is known as a "blocking situation", as this powerful anticyclone holds out for several days. This is what happened in 2023, when for 15 days it was warmer in the north than in the south, with many records broken. [110] [111]
Winds
Wind direction and speed are largely determined by highs and lows. In the Northern Hemisphere, the wind blows counter-clockwise around a low-pressure system and clockwise around a high-pressure system. Its speed is proportional to the pressure difference between two points. The terrain can also channel the airflow. As a result, winds appear more frequently in certain regions and are more sustained: these are regional winds. [112] [113]
Some regional wind denominations actually coincide with a large-scale wind. For example, la bise is a common regional name for the cold, fairly dry north-to-northeasterly wind in central and eastern France and Switzerland, blowing mainly at high altitude. Other regional winds, on the other hand, have peculiarities of speed and direction that distinguish them from the large-scale wind: they reveal the existence of an interaction between certain topographical factors and the large-scale meteorological situation. These include the mistral (a cold, generally dry wind, blowing during the day at an average speed of 50 km/h with gusts in excess of 100 km/h across the lower Rhône valley and Provence, and invading the Mediterranean coastline from the Camargue onwards), the tramontane (a violent, cold, west to north-westerly wind crossing the foothills of the Pyrenees and the southern Massif Central mountains) or the marin (a south-easterly wind blowing across the entire Mediterranean coastal area). [112] [114]
Clouds and precipitation
In meteorology, a cloud is a visible mass initially made up of a large number of water droplets (sometimes ice crystals combined with chemical aerosols or minerals) suspended in the atmosphere above the surface of a planet. The appearance of a cloud depends on its nature, its size, the light it receives, and the number and distribution of its constituent particles. Clouds in the International Cloud Atlas are classified into ten genera, illustrated in the image opposite. [115] [116]
Météo-France distinguishes three main types of precipitation: Episodes of great geographical extent, affecting one or more departments, with heavy rainfall, usually of long duration (up to several days), but with no remarkable intensity; episodes of great geographical extent, affecting one or more departments, with very high intensities; and localized thunderstorms, which can, over a short period of time and within a limited perimeter, dump huge quantities of water. [117]
Extreme weather events
France's position in terms of disasters
According to a survey published in 2019 by the German association Germanwatch, France ranks 15th (out of 183 countries) among the nations most exposed to extreme weather events worldwide. The NGO estimates that nearly 500,000 people died worldwide over the period 1999–2018 as a result of one of the 12,000 exceptional climatic events that affected the globe. France would be the eighth most exposed country in terms of the number of deaths for the period 1999–2018 in relation to its total population, mainly due to several deadly heatwaves: that of 2003 (15,000 deaths), 2006 (1,800) and 2018 (1,500). [118] Météo France states that, to date, global warming "has not been accompanied by any notable changes in the frequency and intensity of storms across France, nor in the number and intensity of heavy rainfall events in the South-East". [119] According to meteorologist Guillaume Séchet, "as a result of global warming, it is estimated that by 2100 France will experience around 20% more Mediterranean episodes ", with more dramatic consequences due to increasing soil sealing and demographic pressure in the regions concerned. [120]
Historical storms
Every year, several storms hit mainland France, each with its own specific characteristics (trajectory, size, speed, stage of development, etc.). The areas affected and the damage caused are highly variable, but two main types of storm can be distinguished. [121]
- Oceanic storms: the most exposed regions are between Pays de la Loire and Normandy and, to a lesser extent, Poitou-Charentes, as well as an area stretching from Île-de-France to the north and Alsace. The south-west is less frequently affected, particularly the inland areas, which are rarely affected (although Aquitaine has experienced at least eight wind disasters, including three prior to 1850, i.e. before the end of the Little Ice Age, and two particularly severe ones in more recent times, in 1893 and 1915). [7]
- Mediterranean storms: these mainly affect the south-east of France and the Massif Central, but can sometimes spill over into neighboring regions. They are often longer-lasting than oceanic storms, and can therefore cause considerable damage.
The most notable recent storms are Lothar ( 25 and 26 December 1999), Martin ( 27 and 28 December 1999), Klaus (24 January 2009), Xynthia ( 27 and 28 February 2010) and Alex ( 1 and 2 October 2020). [121]
Historic floods
Since 1930, 17 disastrous floods have caused more than 5 deaths, 7 of them more than 20. [122]
- On 3 March 1930, flooding of the Tarn, Agout and their tributaries inundated many towns, particularly Moissac and Montauban. They destroyed 3,000 homes and 9 major bridges. Nearly 200 people died, including 130 in Moissac. [123] [124]
- in 1940, violent rainfall caused several rivers in Catalonia to overflow their banks, flooding the Pyrénées-Orientales region in particular. Over 300 people died in Catalonia and 57 in France, almost half of them in Amélie-les-Bains [125] and the surrounding area.
- On 14 July 1987, violent storms caused the Borne River to overflow its banks in Haute-Savoie, killing 23 people in Le Grand-Bornand. [126]
- On 22 September 1992, the Ouvèze overflowed its banks and flooded the town of Vaison-la-Romaine (Vaucluse), killing 47 people, including 34 in Vaison-la-Romaine. [127]
- In November 1999, several rivers in the southern Mediterranean region overflowed their banks. The floods claimed 35 lives. 438 communes were affected. [128]
- on 8 and 9 September 2002, more than 5,000 km2 (an area almost the size of the Gard department) received rainfall in excess of 200 mm over 2 days, with a maximum of around 700 mm. The floods claimed 24 lives. 419 communes were affected [129]
- On 15 June 2010, in the city of Draguignan, but also nearby in Figanières, Trans-en-Provence, Le Luc, Fréjus, Saint-Aygulf and Le Muy, runoff and river overflows caused 23 casualties. [130]
Historical heat waves and droughts
Heat waves and droughts
Three heat waves were recorded between 1976 and 2003. The summer of 1976 is remembered for the drought that caused the worst agricultural damage, but it was above all a major heatwave in which some twenty départements saw their mortality rates rise by more than 10% above seasonal norms, representing 6,000 excess deaths that went unnoticed at the time. [131] The July 1983 heatwave in south-eastern France resulted in 4,700 excess deaths across the whole of France. 1994 was the second hottest summer in the 50-year period preceding 2003. [131]
After 2003, seven notable heatwaves can be counted: 2006, 2015, 2017, 2018, 2019, 2020 and 2022. With three heatwaves, the summer of 2022 was the deadliest since 2003, with 2,816 deaths137 , compared with more than 15,000 in 2003. [132] [133]
Droughts
The drought of 1976, described by then President Valéry Giscard d'Estaing as a "national calamity", was one of the worst in France's history. A 2.2 billion franc aid package for farmers was decided. It was partly financed by an exceptional drought tax based on income tax, paid by over 3 million taxpayers, 9.5 million of whom were exempt. The total amount of drought aid was set at 6 billion euros on 22 September 1976, 90% of which went to livestock farmers, according to departmental distribution. [134]
The drought of 2022 has also been described as historic. The temperature anomaly reached +3.8 °C over the months of May, June, July and August, compared with the 1960–1990 period. [135] July 2022 was the second driest month on record in France, after March 1961, with a precipitation deficit of around 84% compared with the 1991–2020 period. As of 4 August 2022, 62 departments, mainly in the western and southern halves of the country, were at maximum drought "crisis" alert level, with significant restrictions on water abstraction. [134] [136]
Climate change
The average temperature in mainland France in 2022 was 14.5 °C, the highest on record. This is 1.66 °C higher than temperatures measured between 1900 and 1930, with 1.63 °C attributable solely to human activity. Analysis of more precise temperature data between 2010 and 2019 shows that, over this short period, France is warming by 0.1 °C every 3 years. Climate projections produced by Météo-France in 2021 predict a temperature rise of 2.2 degrees in France by 2100, based on the RCP 4–5 intermediate scenario of the IPCC's Sixth Assessment Report. However, according to a study published in October 2022 by several scientific institutions, including the Centre national de la recherche scientifique (CNRS) and Météo-France, the temperature rise in France could reach 3.8 degrees in 2100 on the basis of this scenario, i.e. up to 50% more intense over the course of the century than previous estimates showed.
The impacts of global warming are already visible and are set to intensify, whether they be environmental ( coastal erosion and flooding, species migration or extinction, increases in invasive species, adaptation, migration or extinction of marine species or mangroves), societal (agricultural model under severe threat, heat islands in certain cities), health (drinking water supply, new risks such as chikungunya or dengue fever) or economic (conversion of certain winter sports resorts).
France's climate policy
To meet the two objectives of the Paris climate agreement (warming well below 2 °C and preferably limited to 1.5 °C), a sharp and immediate reduction in CO2 emissions is essential, until carbon neutrality is achieved in 2050, the only way to halt global warming. Reducing emissions of other greenhouse gases, particularly methane, is also relevant. To meet this objective, France, through its climate policy, is deploying various mitigation and adaptation strategies), with specific targets such as reducing greenhouse gas emissions by 50% between 1990 and 2030 (20% in 2019) or reducing final energy consumption by 50% in 2050 compared with the 2012 baseline, with an intermediate target of 20% in 2030.
See also
References
- ^ "De nouvelles normales pour qualifier le climat en France | Météo-France". meteofrance.com. Retrieved 26 February 2024.
- ^ Bernard, Vincent; Cassou, Christophe; Castège, Iker; Chaalali, Aurélie; Idier, Déborah; Le Cozannet, Gonéri; Planton, Serge; Ribes, Aurélien. "Du climat global au climat régional.". Les impacts du changement climatique. Pessac: Presses Universitaires de Bordeaux.
- ^ "Outre-mer français et européen (statuts)". 2023.
- ^ a b Bréon & Luneau (2021, p. 16)
- ^ Deconinck (2006, pp. 148–149)
- ^ "Conférences sur l'archéologie. Les changements climatiques rapides de la dernière période glaciaire et la fin des Néandertaliens". Inrap (in French). 12 January 2010. Retrieved 26 February 2024.
- ^ a b c Grousset, Francis (2013). "Chapitre 2 : Du climat du passé au climat du futur". Les impacts du changement climatique en Aquitaine, À la croisée des sciences. Presses Universitaires de Bordeaux. ISBN 979-10-300-0374-1.
- ^ Michel, François (2005). Roches et paysages, reflets de l'histoire de la Terre. Paris: brgm éditions. p. 154. ISBN 2-7011-4081-1.
- ^ Valentin, Boris; Bodu, Pierre; Julien, Michèle (2004). "Habitats et peuplements tardiglaciaires du Bassin parisien. Projet collectif de recherche 2003–2005". Rapport d'activité pour 2004.: 88–94.
- ^ Valentin, Boris (27 October 1995). Les groupes humains et leurs traditions au Tardiglaciaire dans le Bassin parisien. Apports de la technologie lithique comparée (phdthesis thesis) (in French). Université Panthéon-Sorbonne – Paris I.
- ^ a b Pigeaud, Romain (2023). "Les grottes ornées, témoins du climat ?". Dossiers d'archéologie. 16. ISSN 1141-7137.
- ^ Valentin, Boris (27 October 1995). Les groupes humains et leurs traditions au Tardiglaciaire dans le Bassin parisien. Apports de la technologie lithique comparée (phdthesis thesis) (in French). Université Panthéon-Sorbonne – Paris I.
- ^ Naudinot, Nicolas; Fagnart, Jean-Pierre; Langlais, Mathieu; Mevel, Ludovic; Valentin, Boris (1 December 2019). "Les dernières sociétés du Tardiglaciaire et des tout débuts de l'Holocène en France". Gallia Préhistoire (in French) (59): 5–45. doi: 10.4000/galliap.1394. ISSN 0016-4127. S2CID 194347978.
- ^ Martin, Pierre. Ces risques que l'on dit naturels (Eyrolles, 2006). p. 14.
- ^ Hughes, Philip D.; Woodward, Jamie C (2008). "Timing of glaciation in the Mediterranean mountains during the last cold stage" (PDF). Journal of Quaternary Science. 23 (6–8): 575–588. Bibcode: 2008JQS....23..575H. doi: 10.1002/jqs.1212. S2CID 56429143.
- ^ Bard, Édouard (2013). "Le dernier réchauffement climatique". La Recherche (474): 54–57.
- ^ a b c Brewer, Davis (2003). "Guiot et contributeurs de données, The temperature of Europe during the Holocene reconstructed from pollen data". Quaternary Science Reviews. 22 (15–17). doi: 10.1016/S0277-3791(03)00173-2.
- ^ a b Méhu, Jean. "Évolution climatique". Histoire du Luberon.
- ^ Berger, Jean-François (2010), Demoule, Jean-Paul (ed.), "Les changements climato-environnementaux de l'Holocène ancien et la néolithisation du bassin méditerranéen", La révolution néolithique dans le monde, CNRS Alpha (in French), Paris: CNRS Éditions, pp. 121–144, ISBN 978-2-271-12986-4, retrieved 27 February 2024
- ^ Bernigaud, Nicolas (2023). "Les sociétés face aux changements climatiques en Gaule". Dossiers d'archéologie (416): 48–51. ISSN 1141-7137.
- ^ a b "Les climats". Une géohistoire. pp. 30–31.
- ^ "Les climats". Une géohistoire. pp. 28–29.
- ^ "Les climats". Une géohistoire. pp. 36–37.
- ^ a b "Les climats". Une géohistoire. p. 43.
- ^ Peel; Finlayson; McMahon (2007). "Updated world map of the Köppen-Geiger climate classification". Hydrology and Earth System Sciences. 11 (5): 1633–1644. Bibcode: 2007HESS...11.1633P. doi: 10.5194/hess-11-1633-2007. ISSN 1027-5606.
- ^ Les types de climats en France, une construction spatiale.
- ^ "type 1". Les types de climats en France, une construction spatiale.
- ^ "type 2". Les types de climats en France, une construction spatiale.
- ^ "type 3". Les types de climats en France, une construction spatiale.
- ^ "type 4". Les types de climats en France, une construction spatiale.
- ^ "type 5". Les types de climats en France, une construction spatiale.
- ^ "type 6". Les types de climats en France, une construction spatiale.
- ^ "type 7". Les types de climats en France, une construction spatiale.
- ^ "type 8". Les types de climats en France, une construction spatiale.
- ^ "Le climat en France métropolitaine | Météo-France". meteofrance.com. Retrieved 28 February 2024.
- ^ "Normales et records climatologiques 1971–2000 à Brest-Guipavas – Infoclimat". www.infoclimat.fr. Retrieved 28 February 2024.
- ^ "Normales et records climatologiques 1981–2010 à Brest-Guipavas – Infoclimat". www.infoclimat.fr. Retrieved 28 February 2024.
- ^ "Normales et records climatologiques 1991–2020 à Brest-Guipavas – Infoclimat". www.infoclimat.fr. Retrieved 28 February 2024.
- ^ "Normales et records climatologiques 1971–2000 à Orléans – Bricy – Infoclimat". www.infoclimat.fr. Retrieved 28 February 2024.
- ^ "Normales et records climatologiques 1981–2010 à Orléans – Bricy – Infoclimat". www.infoclimat.fr. Retrieved 28 February 2024.
- ^ "Normales et records climatologiques 1991–2020 à Cambrai-Epinoy – Infoclimat". www.infoclimat.fr. Retrieved 28 February 2024.
- ^ "Normales et records climatologiques 1971–2000 à Cambrai-Epinoy – Infoclimat". www.infoclimat.fr. Retrieved 28 February 2024.
- ^ "Normales et records climatologiques 1981–2010 à Cambrai-Epinoy – Infoclimat". www.infoclimat.fr. Retrieved 28 February 2024.
- ^ "Normales et records climatologiques 1991–2020 à Cambrai-Epinoy – Infoclimat". www.infoclimat.fr. Retrieved 28 February 2024.
- ^ "Normales et records climatologiques 1971–2000 à Besançon – Thise – Infoclimat". www.infoclimat.fr. Retrieved 28 February 2024.
- ^ "Normales et records climatologiques 1981–2010 à Besançon – Thise – Infoclimat". www.infoclimat.fr. Retrieved 28 February 2024.
- ^ "Normales et records climatologiques 1991–2020 à Besançon – Thise – Infoclimat". www.infoclimat.fr. Retrieved 28 February 2024.
- ^ "Normales et records climatologiques 1971–2000 à Bourg-St-Maurice – Infoclimat". www.infoclimat.fr. Retrieved 28 February 2024.
- ^ "Normales et records climatologiques 1981–2010 à Bourg-St-Maurice – Infoclimat". www.infoclimat.fr. Retrieved 28 February 2024.
- ^ "Normales et records climatologiques 1991–2020 à Bourg-St-Maurice – Infoclimat". www.infoclimat.fr. Retrieved 28 February 2024.
- ^ "Normales et records climatologiques 1971–2000 à Marseille–Marignane (Marseille Provence) – Infoclimat". www.infoclimat.fr. Retrieved 28 February 2024.
- ^ "Normales et records climatologiques 1981–2010 à Marseille–Marignane (Marseille Provence) – Infoclimat". www.infoclimat.fr. Retrieved 28 February 2024.
- ^ "Normales et records climatologiques 1991–2020 à Marseille–Marignane (Marseille Provence) – Infoclimat". www.infoclimat.fr. Retrieved 28 February 2024.
- ^ "Un peu de géographie – Pluies extrêmes en France métropolitaine". pluiesextremes.meteo.fr. Retrieved 28 February 2024.
- ^ Dandin, Philippe; Planton, Serge (2011), Jeandel, Catherine; Mosseri, Rémy (eds.), "2. Observations météorologiques et de surface continentale", Le climat à découvert, À découvert (in French), Paris: CNRS Éditions, pp. 88–91, ISBN 978-2-271-11916-2, retrieved 29 February 2024
- ^ Lemaire, Jean; Pigeon, Grégoire (2015). "Aurelhy, ETPQ, Safran et Digitalis : des données climatiques spatialisées pour un diagnostic de qualité". Forêt-entreprise. Paris: Centre national de la propriété forestière (CNPF). pp. 46–52.
- ^ a b c d e LeTreut, Hervé (2013). "Du climat global au climat régional". Les impacts du changement climatique en Aquitaine, À la croisée des sciences (in French). Pessac: Presses Universitaires de Bordeaux. pp. 19–40. ISBN 979-10-300-0374-1.
- ^ "De nouvelles normales pour qualifier le climat en France | Météo-France". meteofrance.com. Retrieved 29 February 2024.
- ^ Canellas, Claire; Gibelin, Anne-Laure; Lassègues, Pierre; Kerdoncuff, Maryvonne; Dandin, Philippe; Simon, Pascal (2014). "Les normales climatiques spatialisées Aurelhy 1981–2010 : températures et précipitations". La Météorologie (in French). 2014 (85): 47–55. doi: 10.4267/2042/53750. ISSN 2107-0830.
- ^ "ARPEGE-Climat – Centre National de Recherches Météorologiques". www.umr-cnrm.fr. Retrieved 29 February 2024.
- ^ "Meteociel – Modèle Numérique ARPEGE Meteo-France". www.meteociel.fr. Retrieved 29 February 2024.
- ^ "ARPEGE – Centre National de Recherches Météorologiques". www.umr-cnrm.fr. Retrieved 29 February 2024.
- ^ "AROME – Centre National de Recherches Météorologiques". www.umr-cnrm.fr. Retrieved 29 February 2024.
- ^ "My CMS – Climate Modeling Center" (in French). Retrieved 29 February 2024.
- ^ "Recherche – Approches méthodologiques – Laboratoire de Météorologie Dynamique" (in French). Retrieved 29 February 2024.
- ^ "De nouvelles normales pour qualifier le climat en France | Météo-France". meteofrance.com. Retrieved 29 February 2024.
- ^ a b c d "Impacts du changement climatique : Atmosphère, Températures et Précipitations". Ministère de la Transition Écologique et de la Cohésion des Territoires (in French). Retrieved 29 February 2024.
- ^ "Envidat". envidat.ch. Retrieved 29 February 2024.
- ^ "Régimes pluviométriques – Pluies extrêmes en France métropolitaine". pluiesextremes.meteo.fr. Retrieved 29 February 2024.
- ^ "Des pluies qui peuvent être diluviennes – Pluies extrêmes en France métropolitaine". pluiesextremes.meteo.fr. Retrieved 29 February 2024.
- ^ "Indicateur national climatologique – Infoclimat". www.infoclimat.fr. Retrieved 29 February 2024.
- ^ "Normales et records climatologiques 1991–2020 à Agen – La Garenne – Infoclimat". www.infoclimat.fr. Retrieved 29 February 2024.
- ^ "Normales et records climatologiques 1991–2020 à Bastia – Poretta – Infoclimat". www.infoclimat.fr. Retrieved 29 February 2024.
- ^ "Normales et records climatologiques 1991–2020 à Besançon – Thise – Infoclimat". www.infoclimat.fr. Retrieved 29 February 2024.
- ^ "Normales et records climatologiques 1991–2020 à Bordeaux-Mérignac – Infoclimat". www.infoclimat.fr. Retrieved 29 February 2024.
- ^ "Normales et records climatologiques 1991–2020 à Bourg-St-Maurice – Infoclimat". www.infoclimat.fr. Retrieved 29 February 2024.
- ^ "Normales et records climatologiques 1991–2020 à Brest-Guipavas – Infoclimat". www.infoclimat.fr. Retrieved 29 February 2024.
- ^ "Normales et records climatologiques 1991–2020 à Caen-Carpiquet – Infoclimat". www.infoclimat.fr. Retrieved 29 February 2024.
- ^ "Normales et records climatologiques 1991–2020 à Châteauroux – Déols – Infoclimat". www.infoclimat.fr. Retrieved 29 February 2024.
- ^ "Normales et records climatologiques 1991–2020 à Clermont-Ferrand – Aulnat – Infoclimat". www.infoclimat.fr. Retrieved 29 February 2024.
- ^ "Normales et records climatologiques 1991–2020 à Cognac-Châteaubernard – Infoclimat". www.infoclimat.fr. Retrieved 29 February 2024.
- ^ "Normales et records climatologiques 1991–2020 à Dijon-Longvic – Infoclimat". www.infoclimat.fr. Retrieved 29 February 2024.
- ^ "Normales et records climatologiques 1991–2020 à Le Mans – Arnage – Infoclimat". www.infoclimat.fr. Retrieved 29 February 2024.
- ^ "Normales et records climatologiques 1991–2020 à Lille-Lesquin – Infoclimat". www.infoclimat.fr. Retrieved 29 February 2024.
- ^ "Normales et records climatologiques 1991–2020 à Lyon-Bron – Infoclimat". www.infoclimat.fr. Retrieved 29 February 2024.
- ^ "Normales et records climatologiques 1991–2020 à Marseille–Marignane (Marseille Provence) – Infoclimat". www.infoclimat.fr. Retrieved 29 February 2024.
- ^ "Normales et records climatologiques 1991–2020 à Montélimar – Ancone – Infoclimat". www.infoclimat.fr. Retrieved 29 February 2024.
- ^ "Normales et records climatologiques 1991–2020 à Nancy-Essey – Infoclimat". www.infoclimat.fr. Retrieved 29 February 2024.
- ^ "Normales et records climatologiques 1991–2020 à Nantes-Atlantique – Infoclimat". www.infoclimat.fr. Retrieved 29 February 2024.
- ^ "Normales et records climatologiques 1991–2020 à Nevers-Marzy – Infoclimat". www.infoclimat.fr. Retrieved 29 February 2024.
- ^ "Normales et records climatologiques 1991–2020 à Nice – Côte d'Azur – Infoclimat". www.infoclimat.fr. Retrieved 29 February 2024.
- ^ "Normales et records climatologiques 1991–2020 à Nimes-Courbessac – Infoclimat". www.infoclimat.fr. Retrieved 29 February 2024.
- ^ "Normales et records climatologiques 1991–2020 à Orléans – Bricy – Infoclimat". www.infoclimat.fr. Retrieved 29 February 2024.
- ^ "Normales et records climatologiques 1991–2020 à Paris-Montsouris – Infoclimat". www.infoclimat.fr. Retrieved 29 February 2024.
- ^ "Normales et records climatologiques 1991–2020 à Pau-Uzein – Infoclimat". www.infoclimat.fr. Retrieved 29 February 2024.
- ^ "Normales et records climatologiques 1991–2020 à Perpignan – Rivesaltes – Infoclimat". www.infoclimat.fr. Retrieved 29 February 2024.
- ^ "Normales et records climatologiques 1991–2020 à Poitiers-Biard – Infoclimat". www.infoclimat.fr. Retrieved 29 February 2024.
- ^ "Normales et records climatologiques 1991–2020 à Reims-Champagne – Infoclimat". www.infoclimat.fr. Retrieved 29 February 2024.
- ^ "Normales et records climatologiques 1991–2020 à Rennes-St Jacques – Infoclimat". www.infoclimat.fr. Retrieved 29 February 2024.
- ^ "Normales et records climatologiques 1991–2020 à Strasbourg-Entzheim – Infoclimat". www.infoclimat.fr. Retrieved 29 February 2024.
- ^ "Normales et records climatologiques 1991–2020 à Toulouse-Blagnac – Infoclimat". www.infoclimat.fr. Retrieved 29 February 2024.
- ^ "Quelle est la température la plus élevée enregistrée en France?". Météo France.
- ^ "METEO FRANCE – Le site institutionnel de Météo-France". meteofrance.fr. Retrieved 29 February 2024.
- ^ a b "Événements paroxystiques – Pluies extrêmes en France métropolitaine". pluiesextremes.meteo.fr. Retrieved 29 February 2024.
- ^ "Aïguat fantastique sur le Roussillon – Pluies extrêmes en France métropolitaine". pluiesextremes.meteo.fr. Retrieved 29 February 2024.
- ^ "Pluies extrêmes en France Métropolitaine – Bienvenue sur le site des pluies extrêmes sur la France métropolitaine". pluiesextremes.meteo.fr. Retrieved 29 February 2024.
- ^ Lacroux, Margaux. "Climat : 2022 pulvérise le record de l'année la plus chaude en France". Libération (in French). Retrieved 29 February 2024.
- ^ "La canicule en France : visualisez les températures dépassées en août 2023 : 43,2 °C à Carcassonne, 42,4 °C à Toulouse, 30,4 °C au mont Aigoual..." Le Monde.fr (in French). 24 August 2023. Retrieved 29 February 2024.
- ^ "Les situations météorologiques types en France | Météo-France". meteofrance.com. Retrieved 29 February 2024.
- ^ "Météo : il fait chaud et ce n'est pas près de s'arrêter". Le Point (in French). 12 June 2023. Retrieved 29 February 2024.
- ^ "Météo : Toujours plus sec et plus chaud au nord qu'au sud ; pourquoi ? | Météo-France". meteofrance.com. Retrieved 29 February 2024.
- ^ a b "Les vents régionaux | Météo-France". meteofrance.com. Retrieved 29 February 2024.
- ^ "Les vents régionaux – Tempêtes en France métropolitaine". tempetes.meteo.fr. Retrieved 29 February 2024.
- ^ "Les vents régionaux méditerranéens – Tempêtes en France métropolitaine". tempetes.meteo.fr. Retrieved 29 February 2024.
- ^ WMO. "Genera". International Cloud Atlas. Retrieved 29 February 2024.
- ^ "Les différents types de nuages | Météo-France". meteofrance.com. Retrieved 29 February 2024.
- ^ "Typologie des précipitations – Pluies extrêmes en France métropolitaine". pluiesextremes.meteo.fr. Retrieved 29 February 2024.
- ^ Mouchon, Frédéric (2019). "Canicules, tempêtes, inondations : la France est devenue un des pays les plus exposés au monde". leparisien.fr (in French). Retrieved 29 February 2024.
- ^ "METEO FRANCE – Le site institutionnel de Météo-France". meteofrance.fr. Retrieved 29 February 2024.
- ^ Mouchon, Frédéric (2019). "Canicules, tempêtes, inondations : la France est devenue un des pays les plus exposés au monde". leparisien.fr (in French).
- ^ a b "Les tempêtes remarquables en France | Météo-France". meteofrance.com. Retrieved 29 February 2024.
- ^ "Les inondations les plus catastrophiques en France depuis 1900". Le Monde.fr (in French). 3 June 2016. Retrieved 1 March 2024.
- ^ "Cent ans d'inondations historiques en France". La Croix (in French). 14 March 2010. ISSN 0242-6056. Retrieved 1 March 2024.
- ^ "Le Sud-Ouest ravagé par les inondations – Pluies extrêmes en France métropolitaine". pluiesextremes.meteo.fr. Retrieved 1 March 2024.
- ^ "Aïguat fantastique sur le Roussillon – Pluies extrêmes en France métropolitaine". pluiesextremes.meteo.fr. Retrieved 1 March 2024.
- ^ "Catastrophe du Grand Bornand – Pluies extrêmes en France métropolitaine". pluiesextremes.meteo.fr. Retrieved 1 March 2024.
- ^ "Vaison la Romaine : la catastrophe – Pluies extrêmes en France métropolitaine". pluiesextremes.meteo.fr. Retrieved 1 March 2024.
- ^ "Catastrophe sur les Corbières – Pluies extrêmes en France métropolitaine". pluiesextremes.meteo.fr. Retrieved 1 March 2024.
- ^ "Catastrophe sur le Gard – Pluies extrêmes en France métropolitaine". pluiesextremes.meteo.fr. Retrieved 1 March 2024.
- ^ "Catastrophe de Draguignan – Pluies extrêmes en France métropolitaine". pluiesextremes.meteo.fr. Retrieved 1 March 2024.
- ^ a b "La France et les Français face à la canicule : les leçons d'une crise". Sénat (in French). 3 April 2023. Retrieved 1 March 2024.
- ^ "La canicule de 2003, un tournant démographique". Le Monde.fr (in French). 27 June 2019. Retrieved 1 March 2024.
- ^ "Retour sur les canicules en France depuis 2003". Les Echos (in French). 11 August 2022. Retrieved 1 March 2024.
- ^ a b "Retour sur les sécheresses en France depuis 1976". Les Echos (in French). 5 August 2022. Retrieved 1 March 2024.
- ^ "2022, une année « hors normes, symptôme du dérèglement climatique »". Le Monde.fr (in French). 30 November 2022. Retrieved 1 March 2024.
- ^ "Sécheresse et chaleur : un mois de juillet 2022 historique". Le Monde.fr (in French). 2 August 2022. Retrieved 1 March 2024.
Bibliography
- External media: Les grandes crises climatiques 3/4 : Le petit âge glaciaire – Les grandes crises climatiques 1/4 : Charlotte Vorms et Jean-François Berger
- Statistiques climatiques de la France 1971–2000. Direction de la Climatologie. 2009. p. 287. ISBN 978-2110987181.
- Joly, Daniel; Brossard, Thierry; Cardot, Hervé; Cavailhes, Jean; Hilal, Mohamed; Wavresky, Pierre (2010). "Les types de climats en France, une construction spatiale". Cybergéo, revue européenne de géographie – European Journal of Geography (501).
- Dandin, Philippe; Planton, Serge (2011). Jeandel, Catherine; Mosseri, Rémy (eds.). Le climat à découvert. CNRS Éditions. doi: 10.4000/books.editionscnrs.11316. ISBN 978-2-271-07198-9.
- Valette, Philippe (2021). Les climats - Une géohistoire - Documentation photographique. Paris: CNRS Editions. ISSN 0419-5361.
- Le Roy Ladurie, Emmanuel (2004). Histoire humaine et comparée du climat, volume 1 : Canicules et glaciers (xiiie – xviiie siècles). Paris: Fayard. ISBN 2-213-61921-2.
- Le Roy Ladurie, Emmanuel (2006). Histoire humaine et comparée du climat, volume 2 : Disettes et révolutions (1740-1860). Paris: Fayard. ISBN 2-213-62738-X.
- Deconinck, Jean-François (2006). Paléoclimats - l'enregistrement des variations climatiques. Paris: Vuibert. ISBN 2-7117-5395-6.
- Bréon, François-Marie; Luneau, Gilles (2021). Atlas du climat. Paris.
ISBN
978-2-7467-6208-4.
{{
cite book}}
: CS1 maint: location missing publisher ( link)